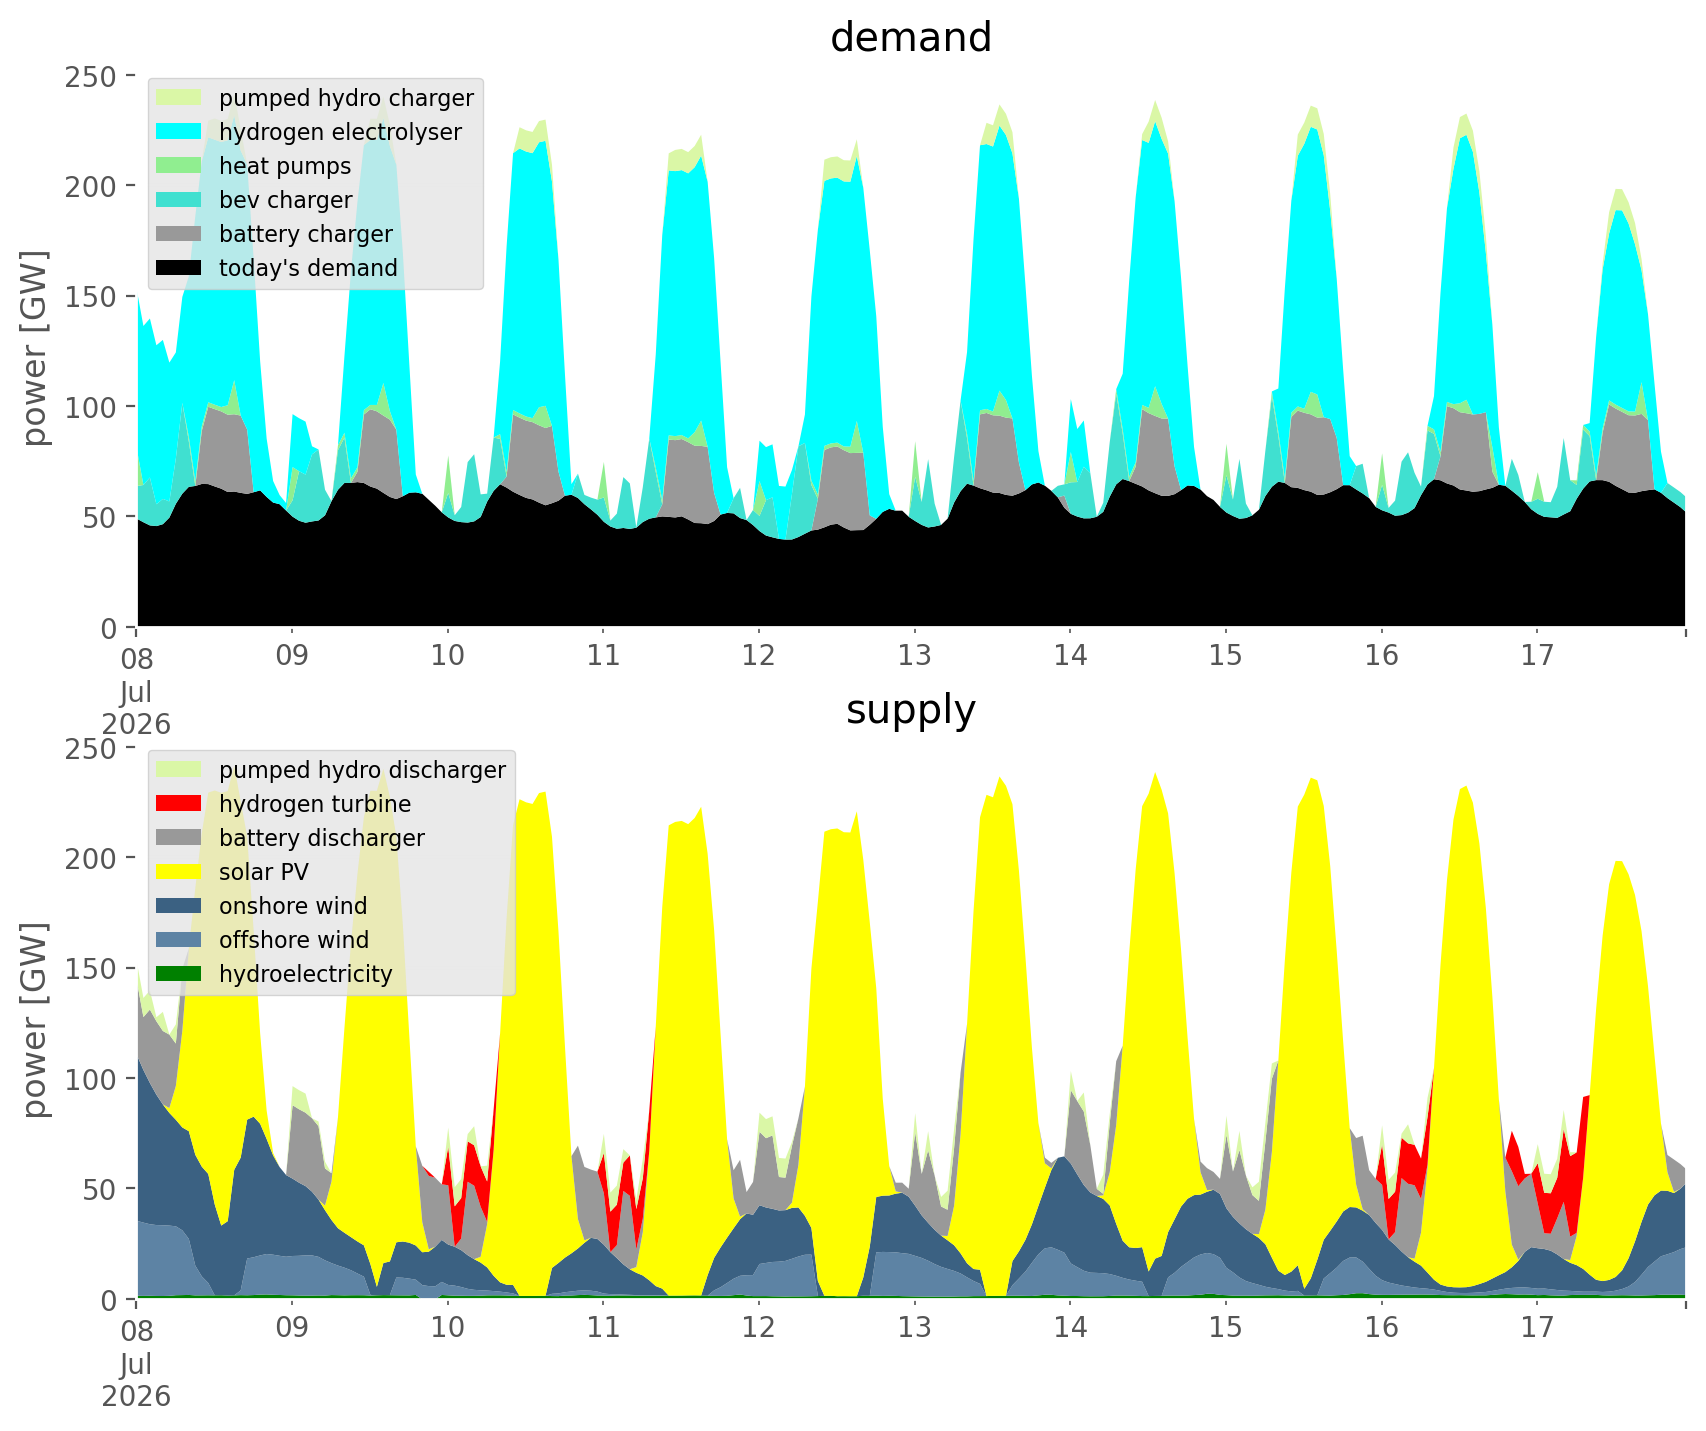
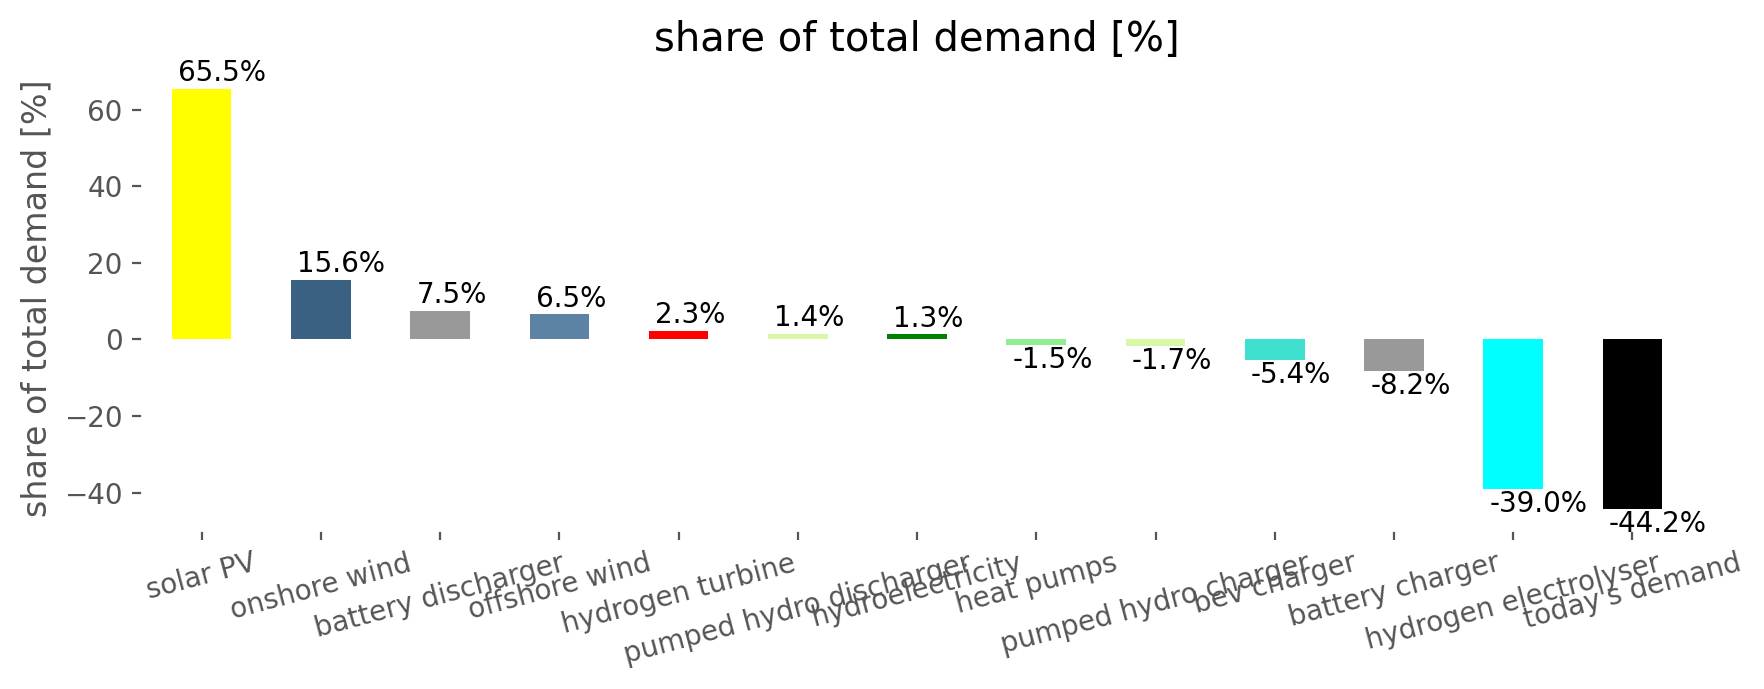
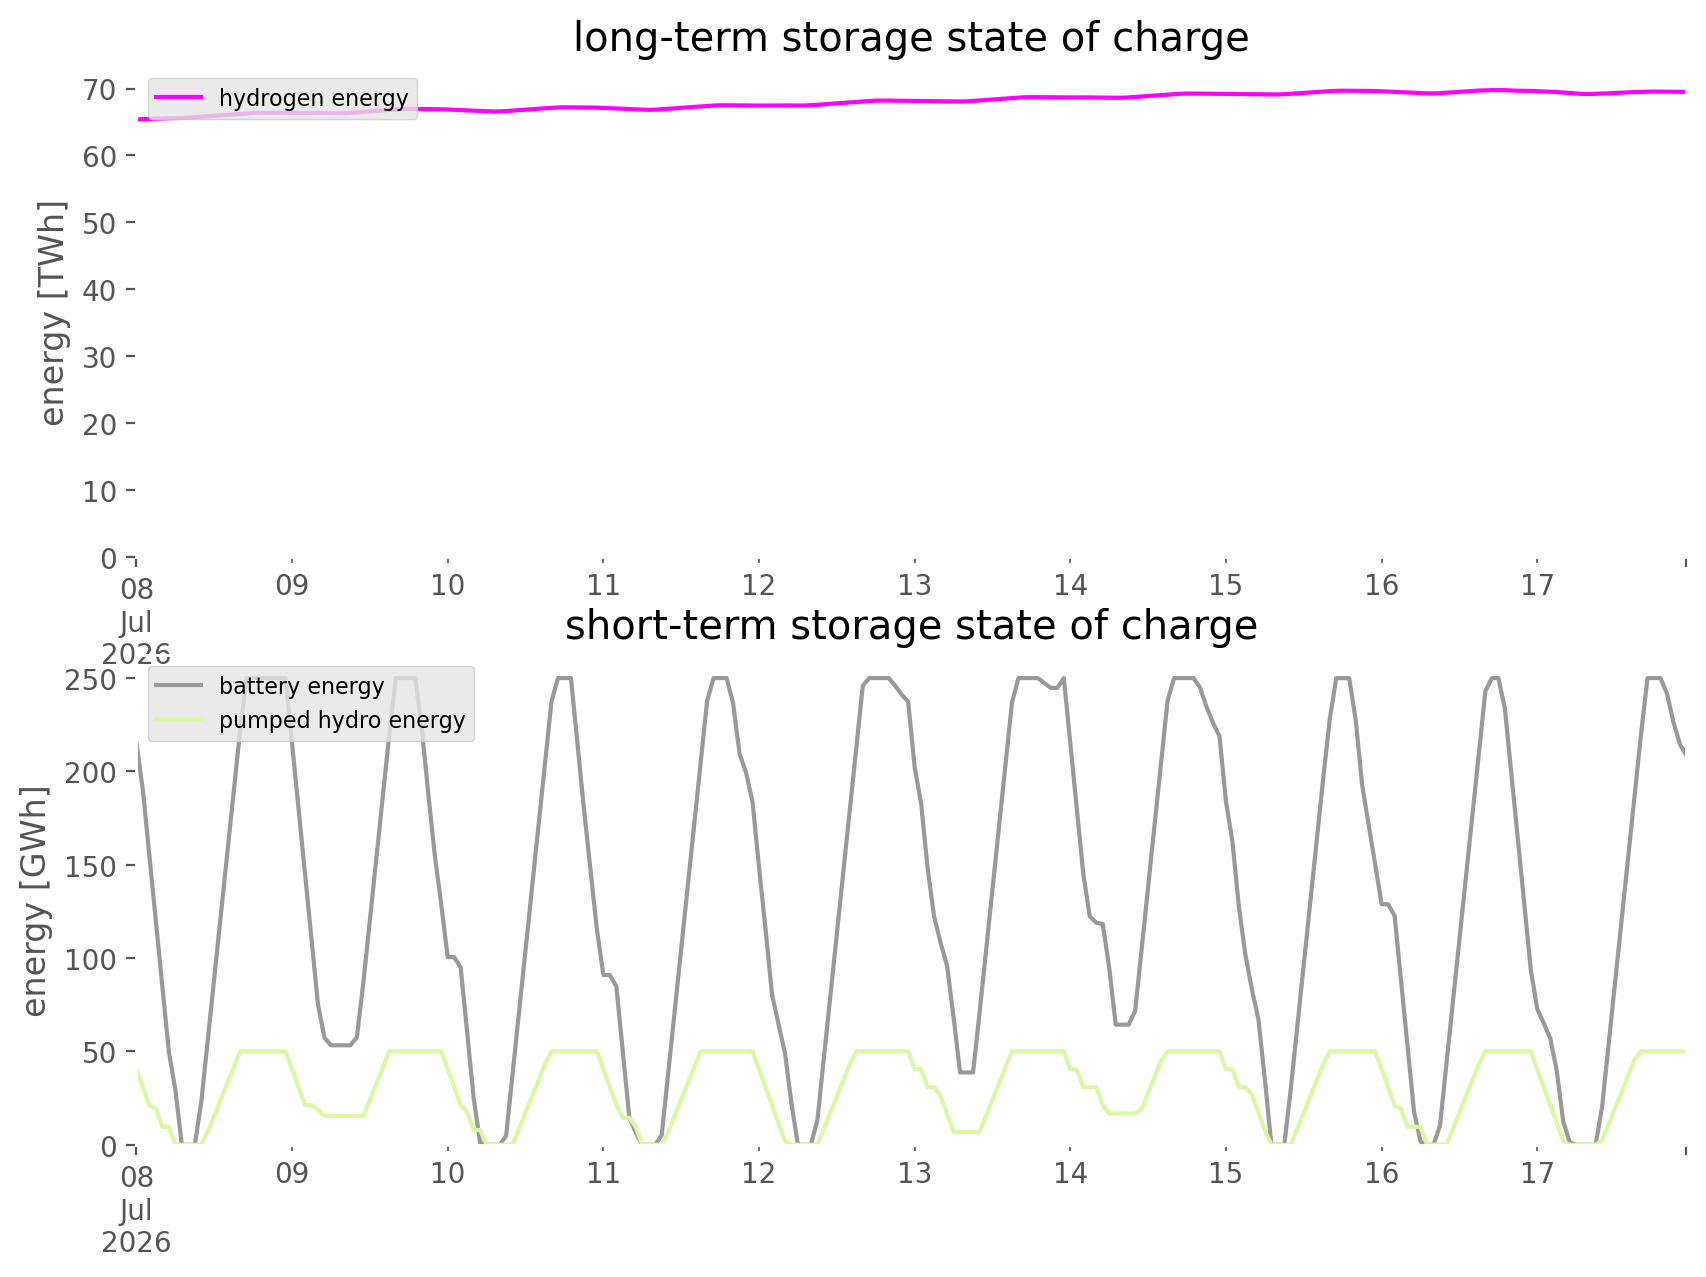
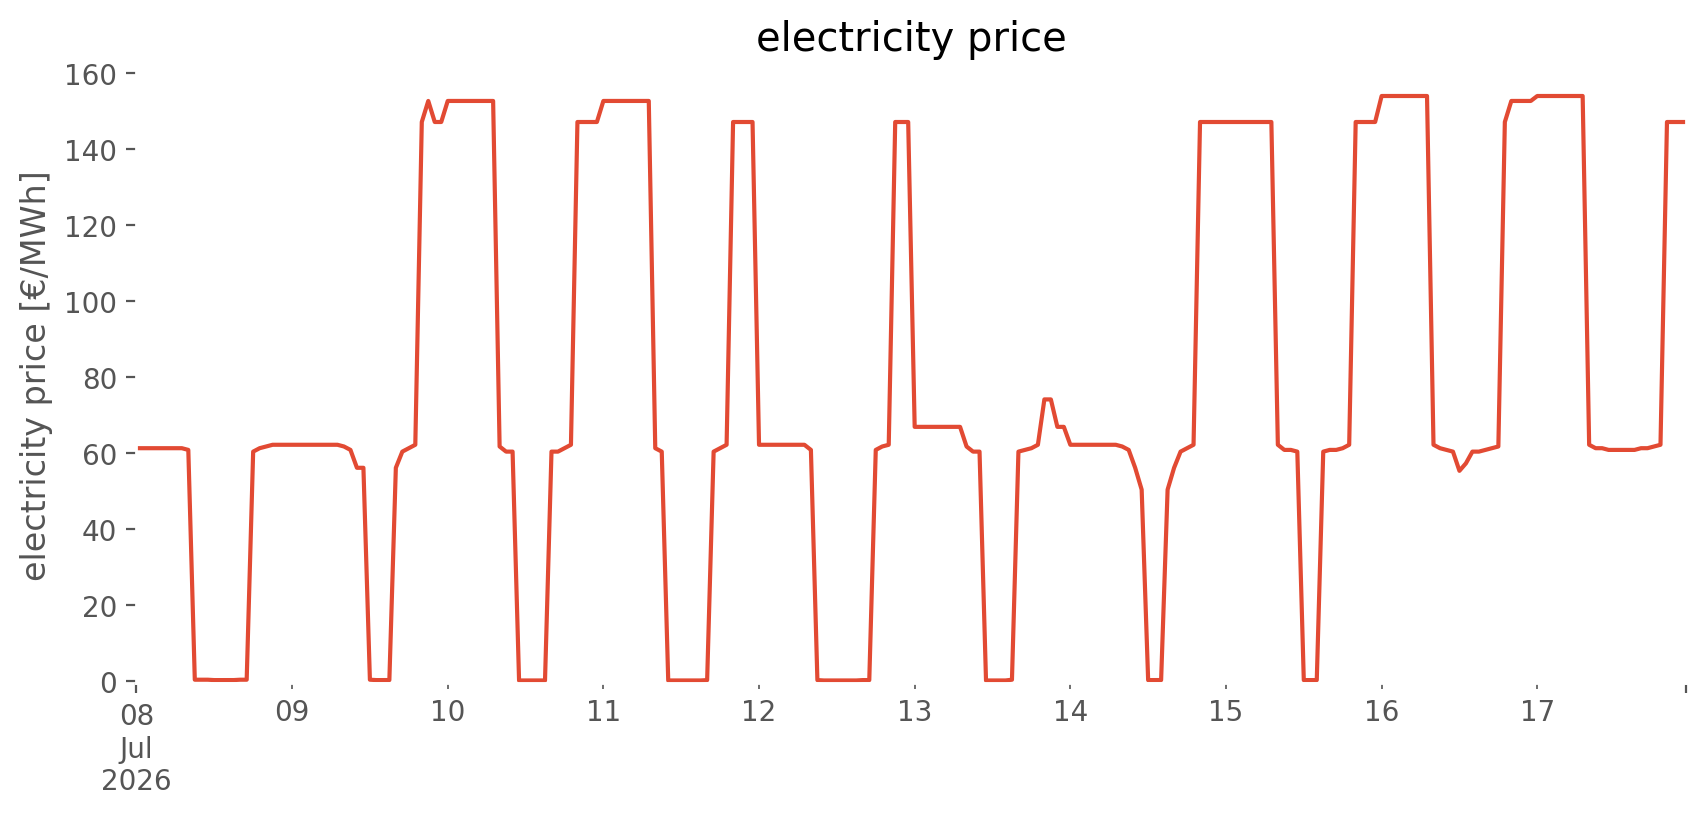
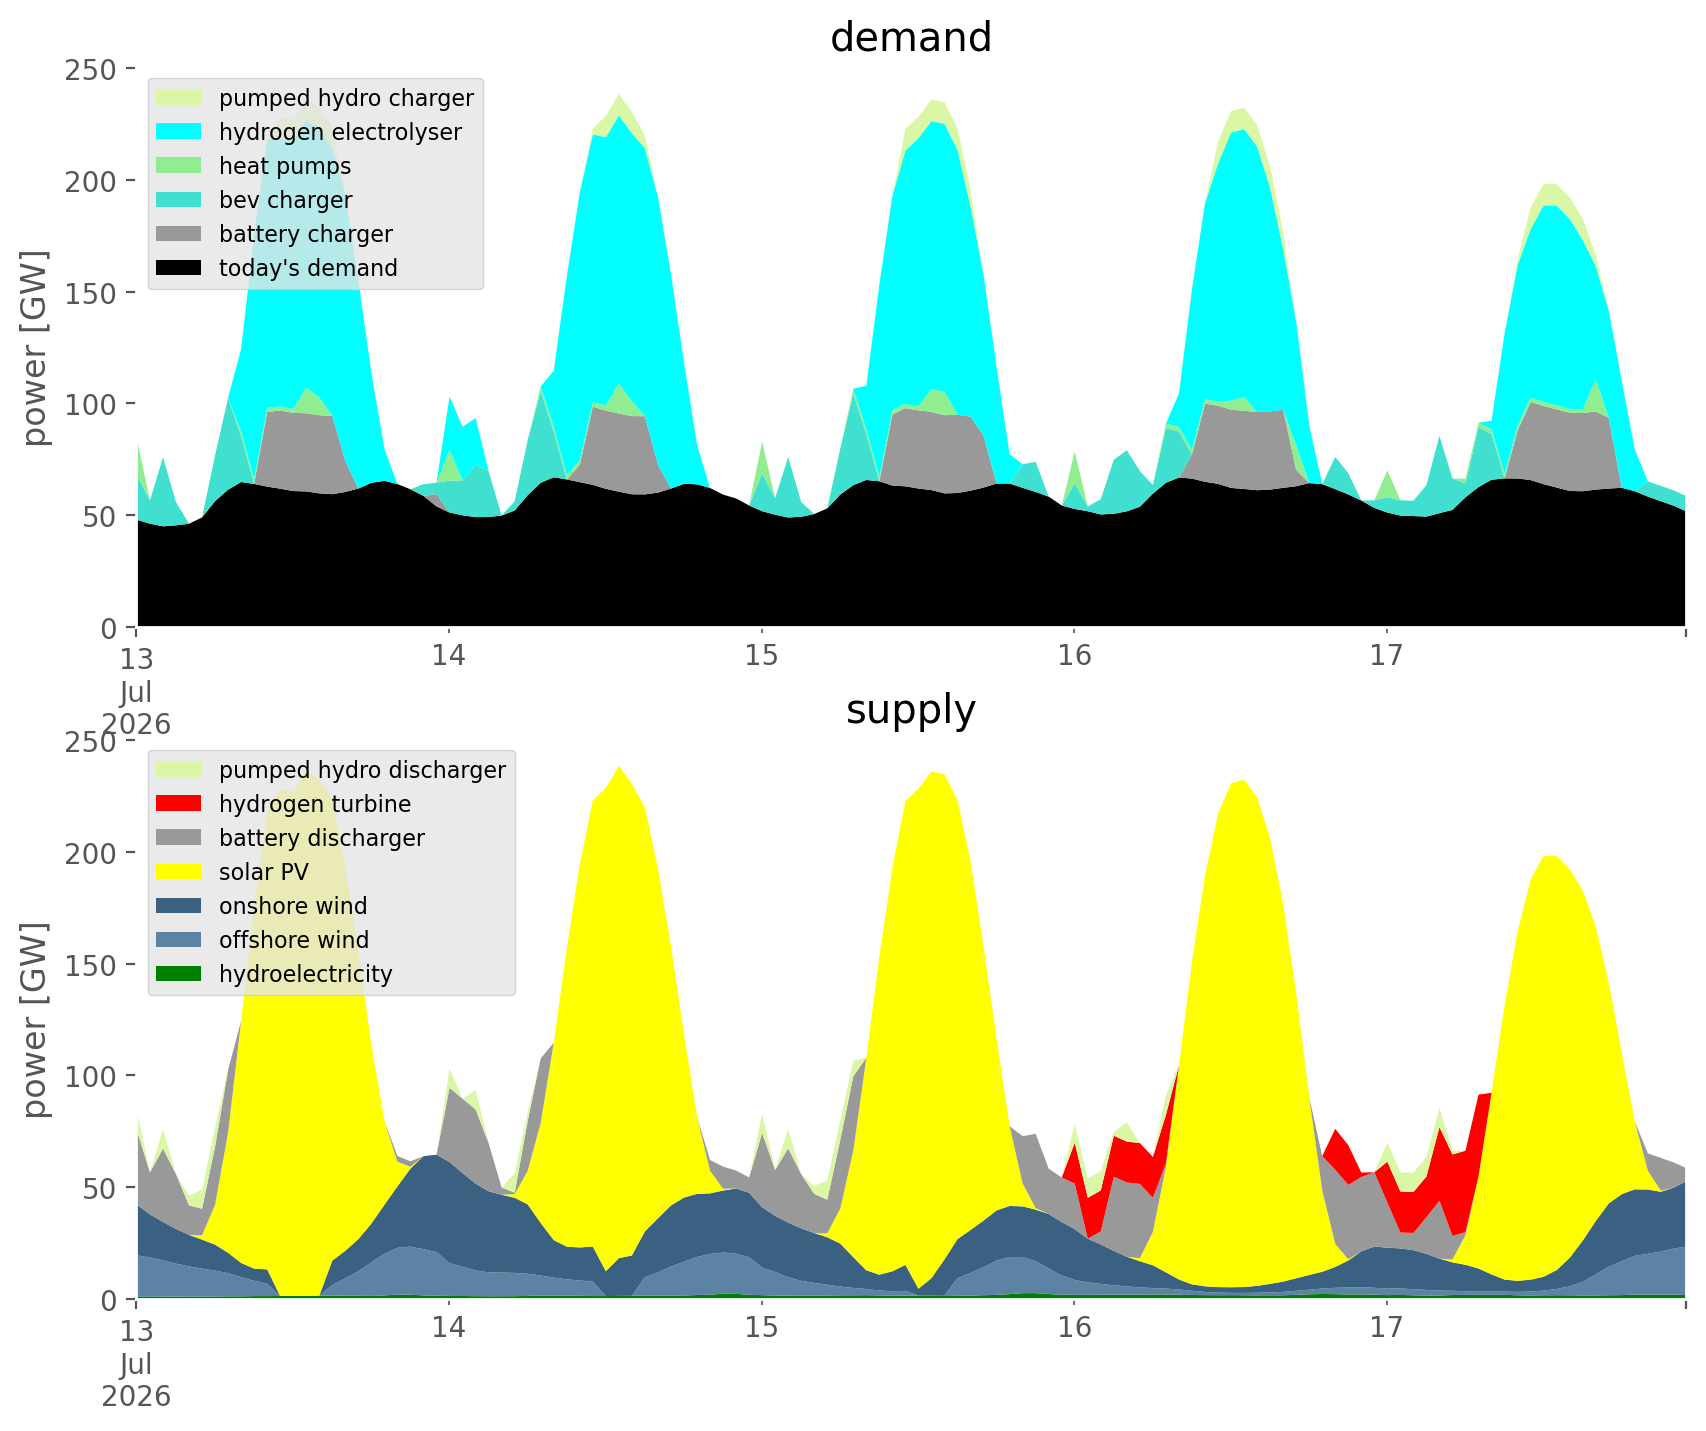
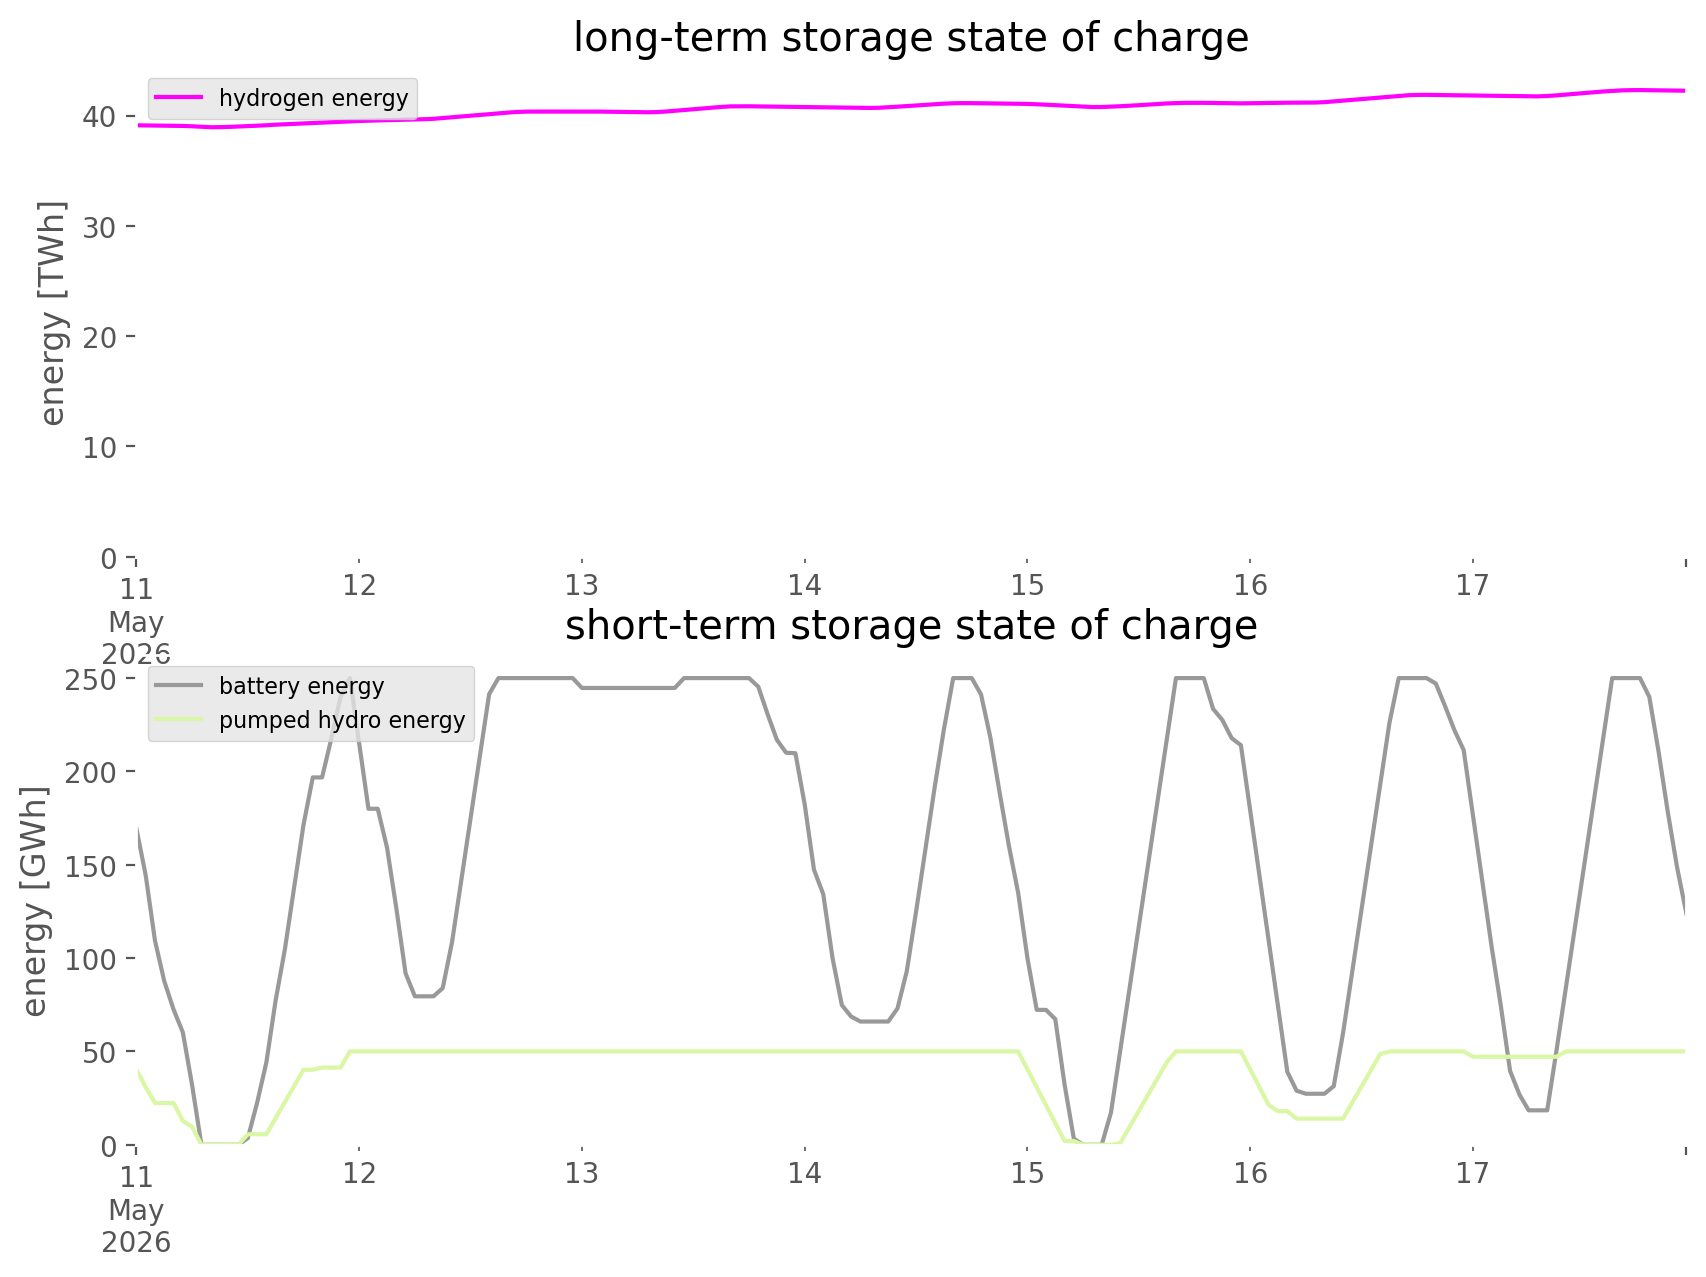
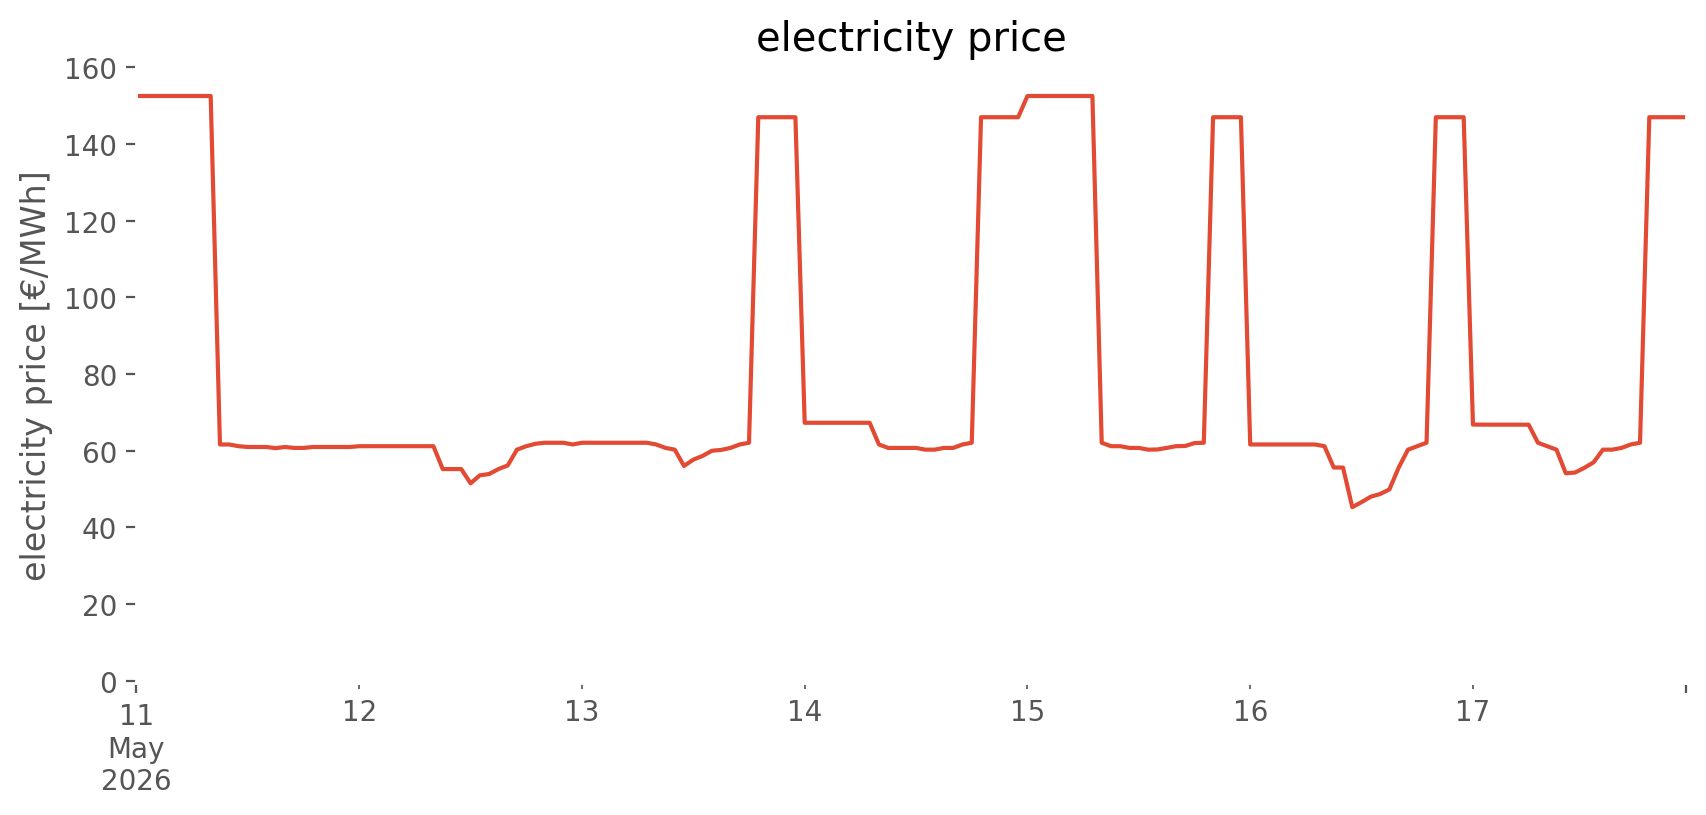
Past 10 days in DE
Full simulation (weekly averages)


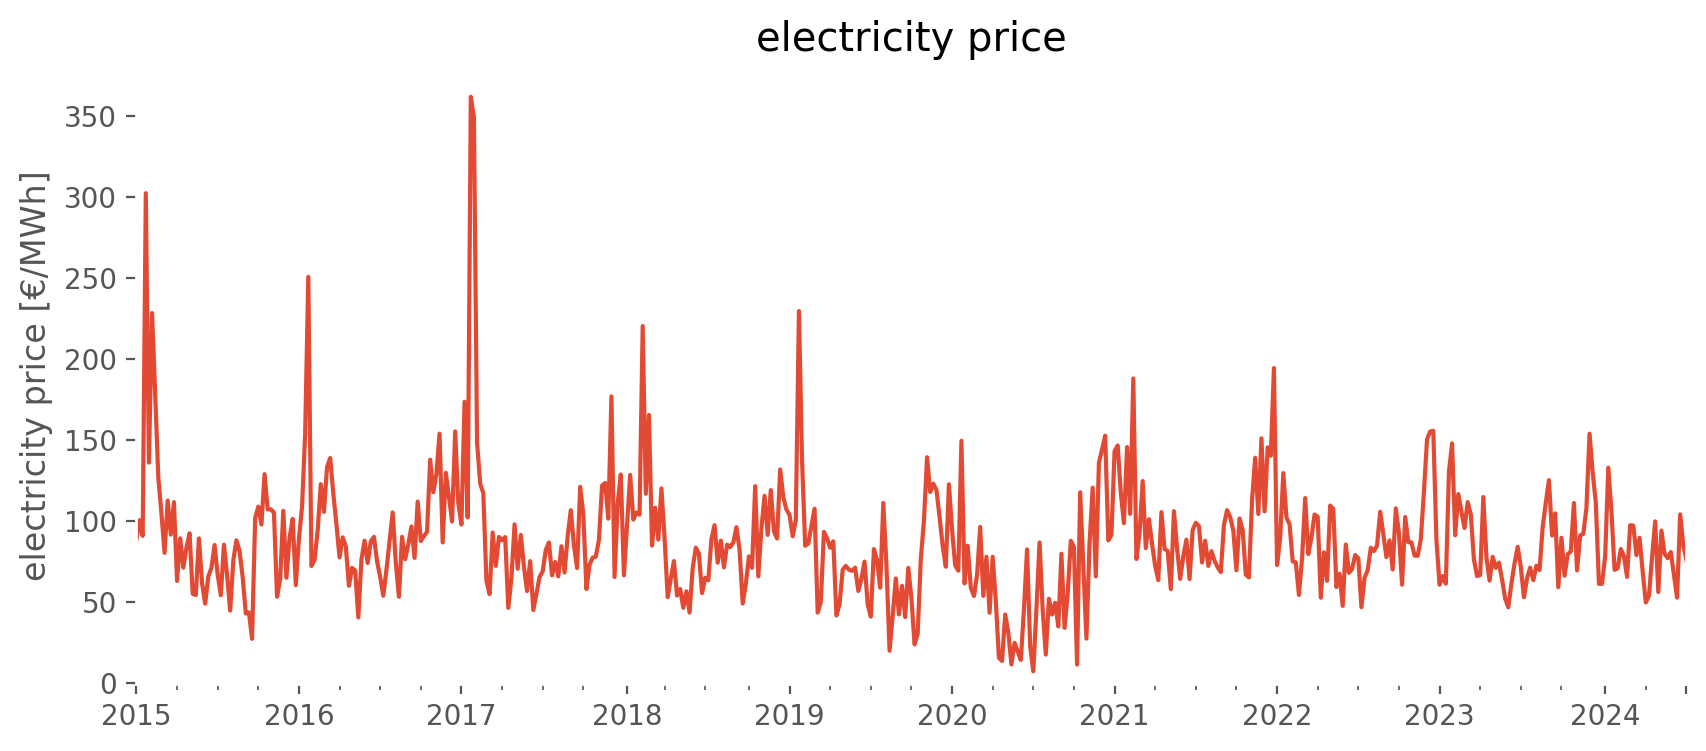
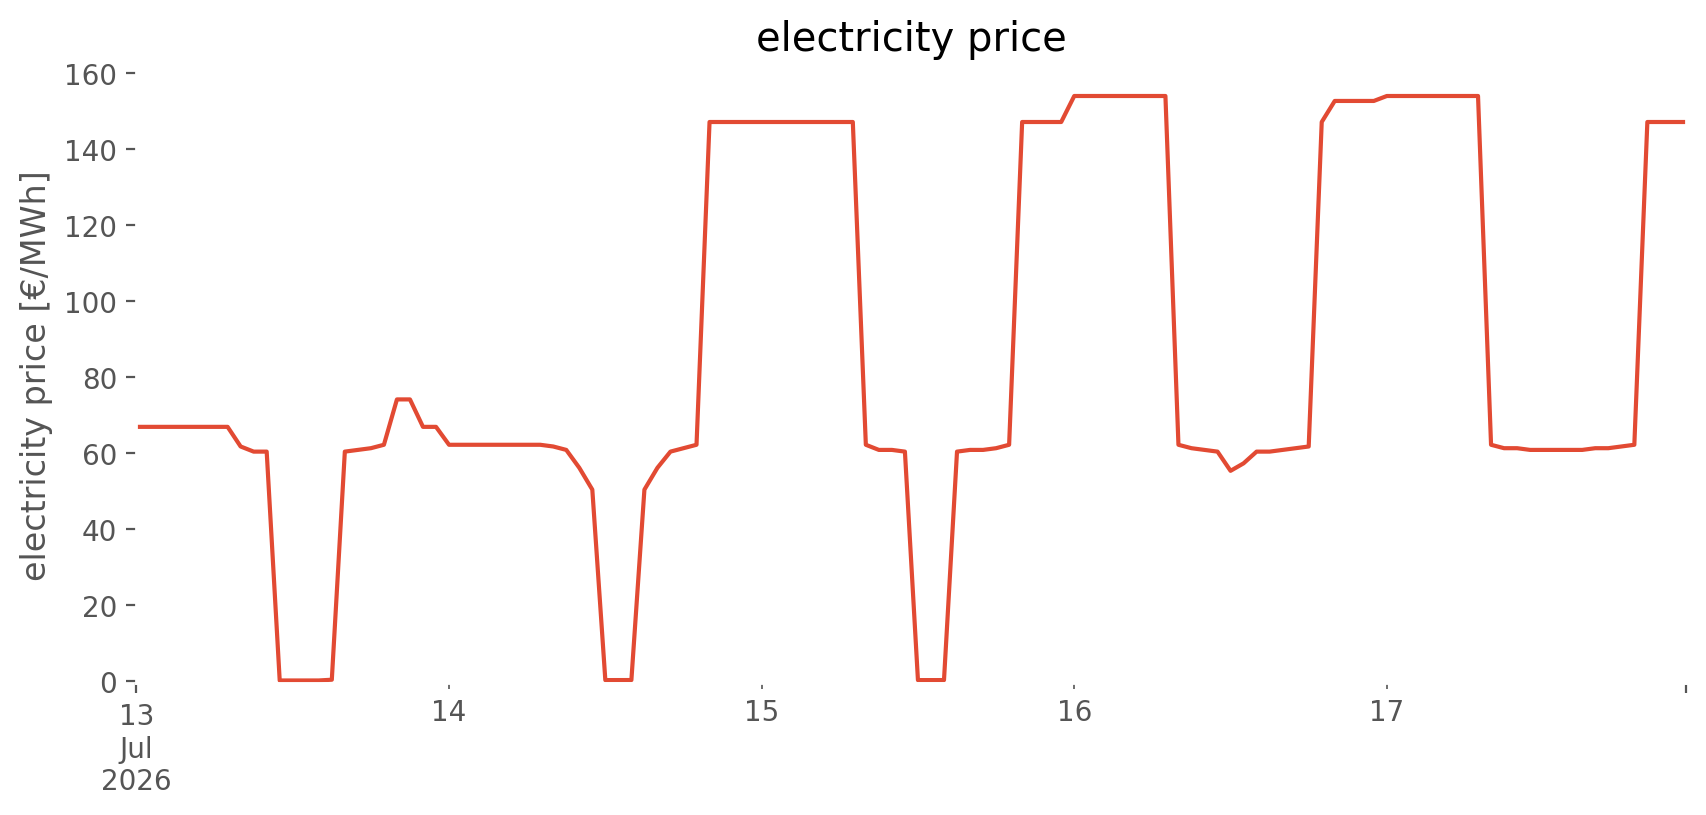
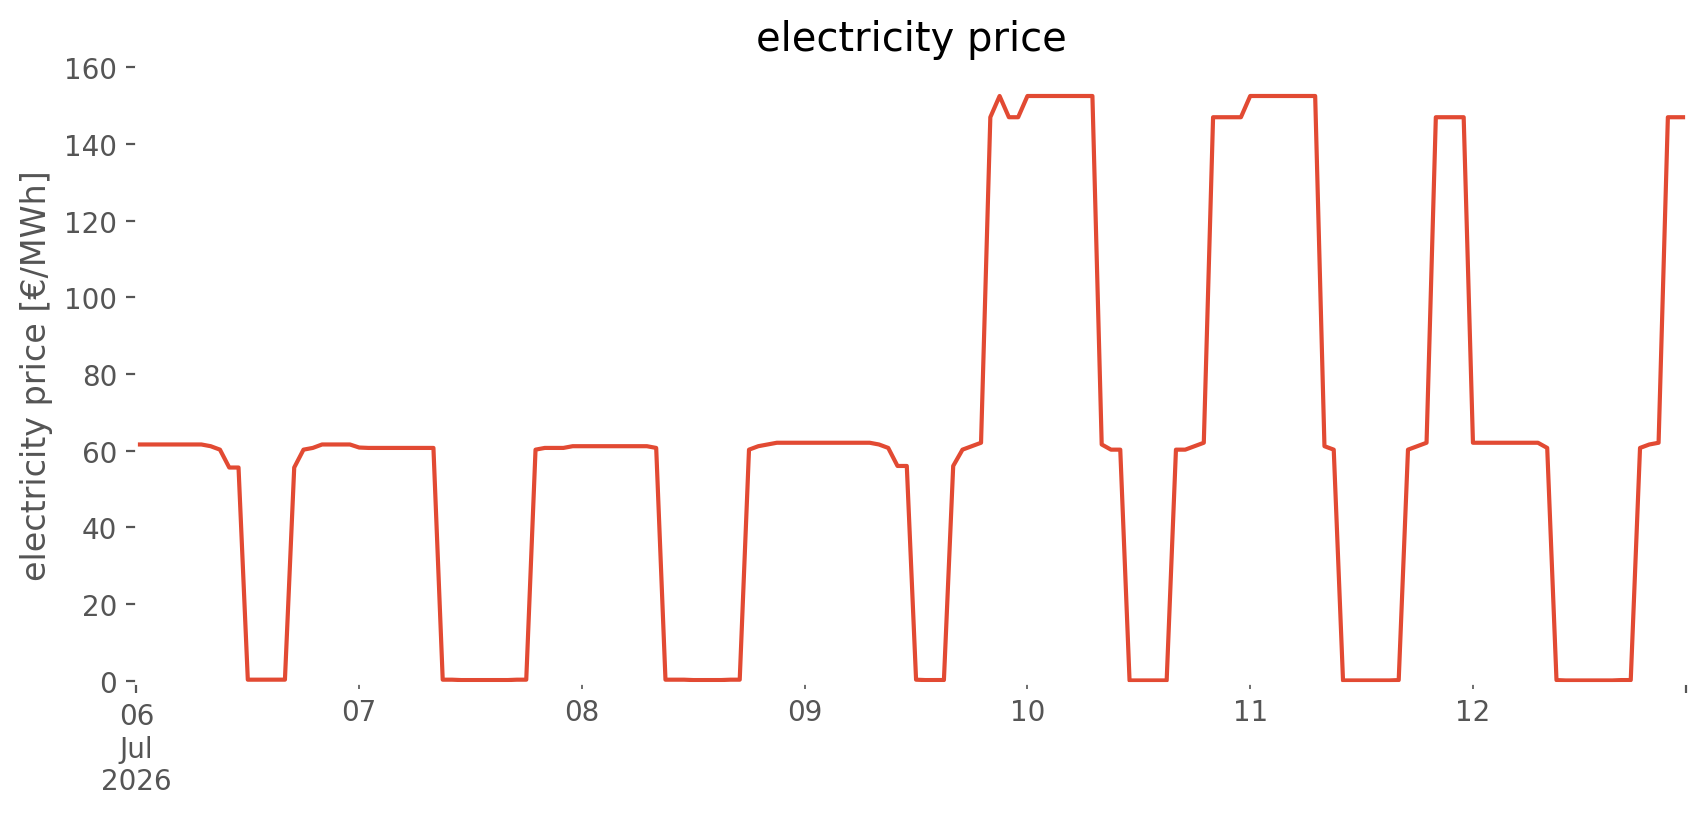
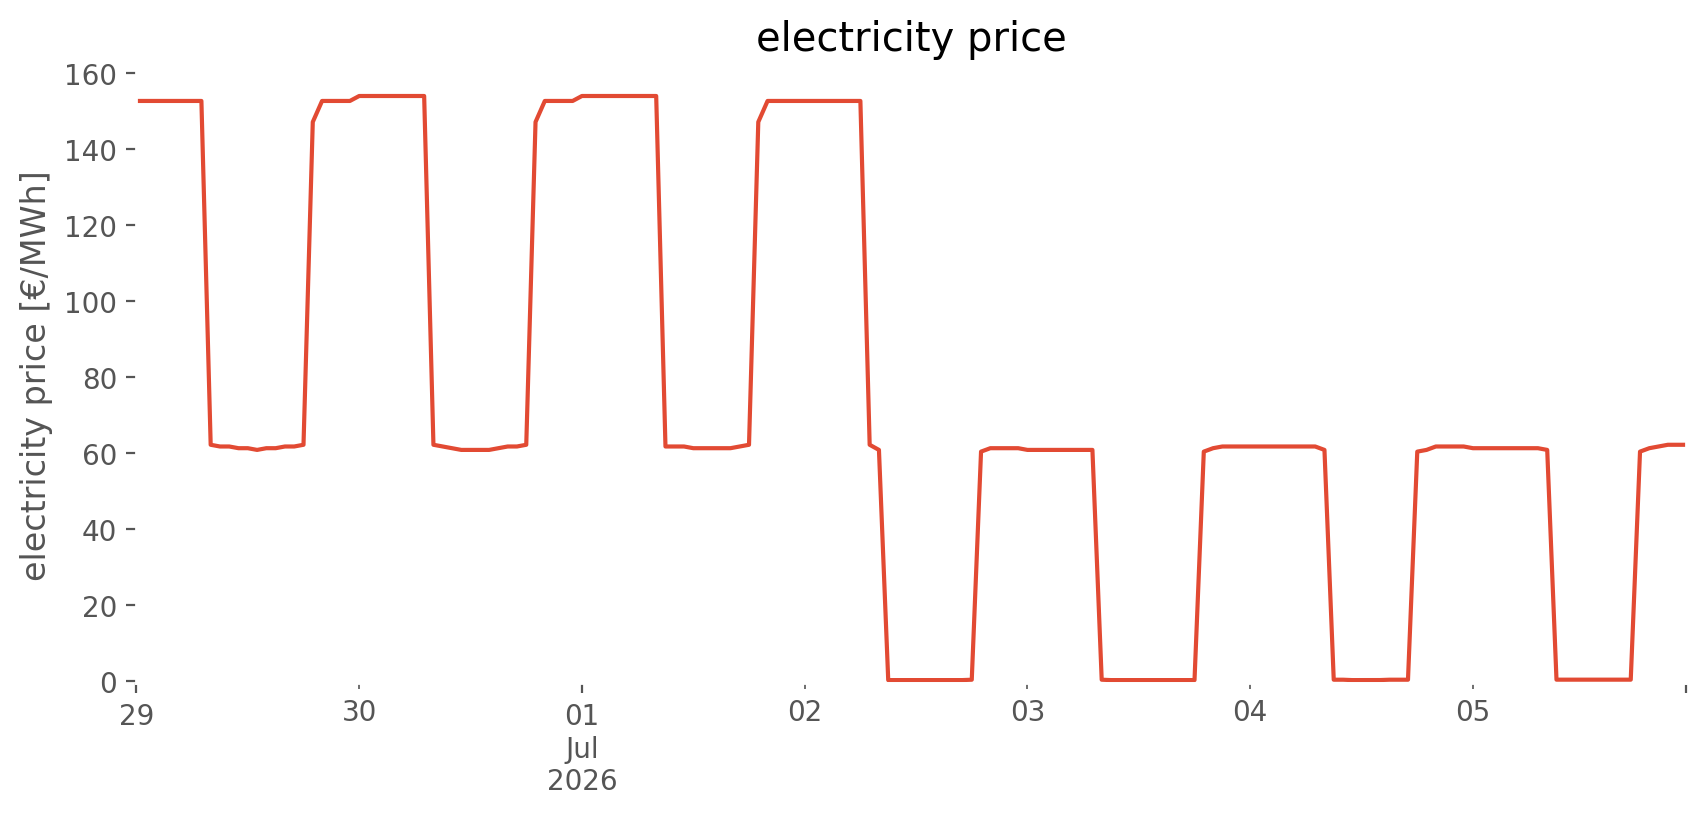
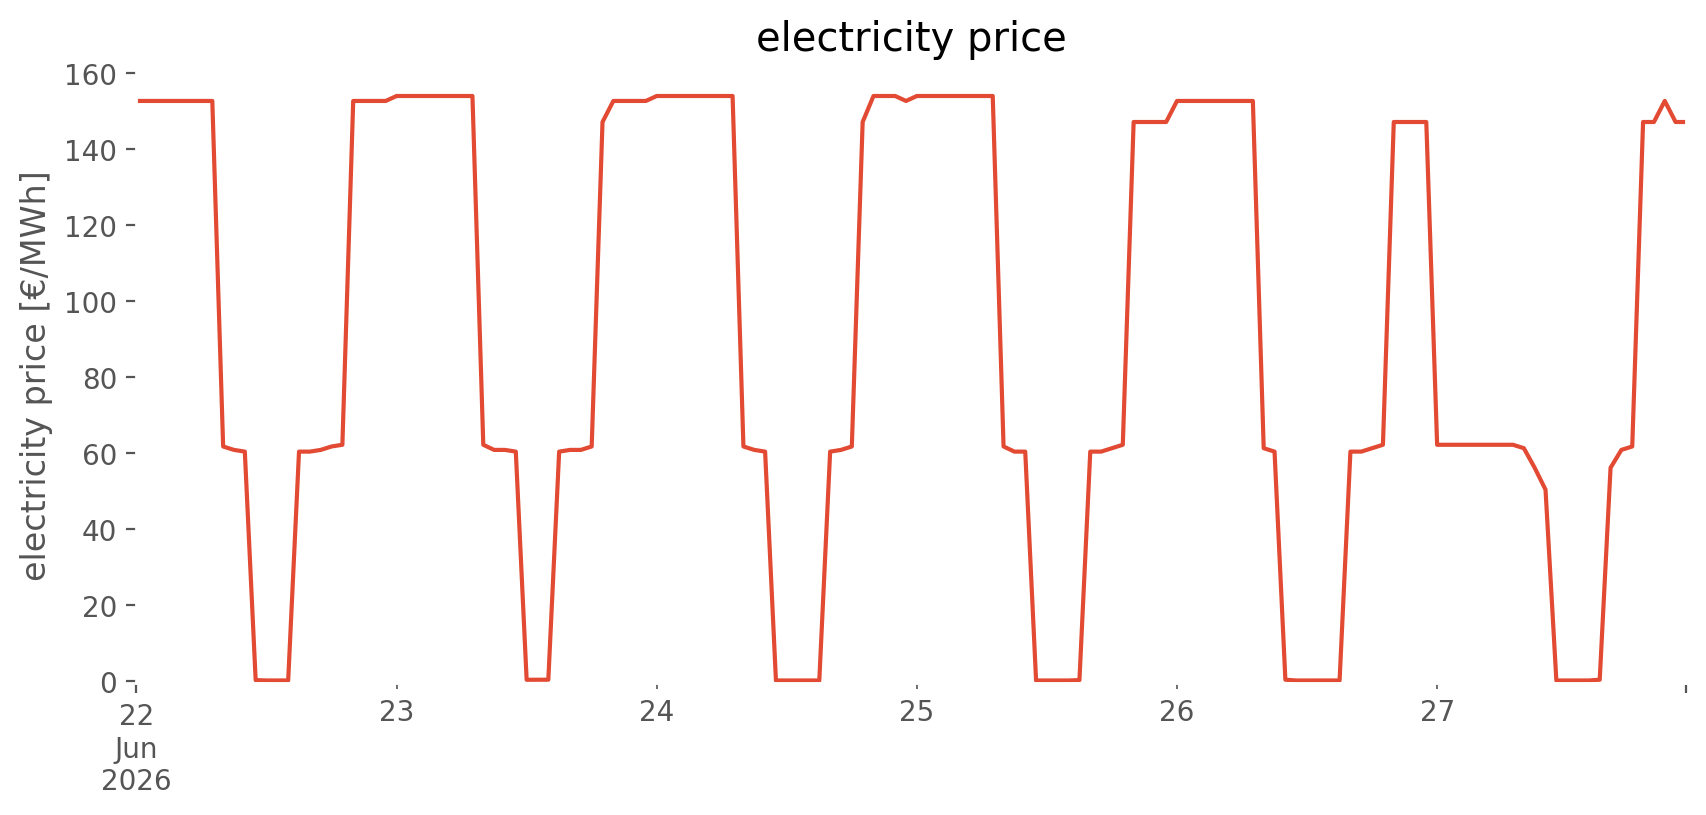
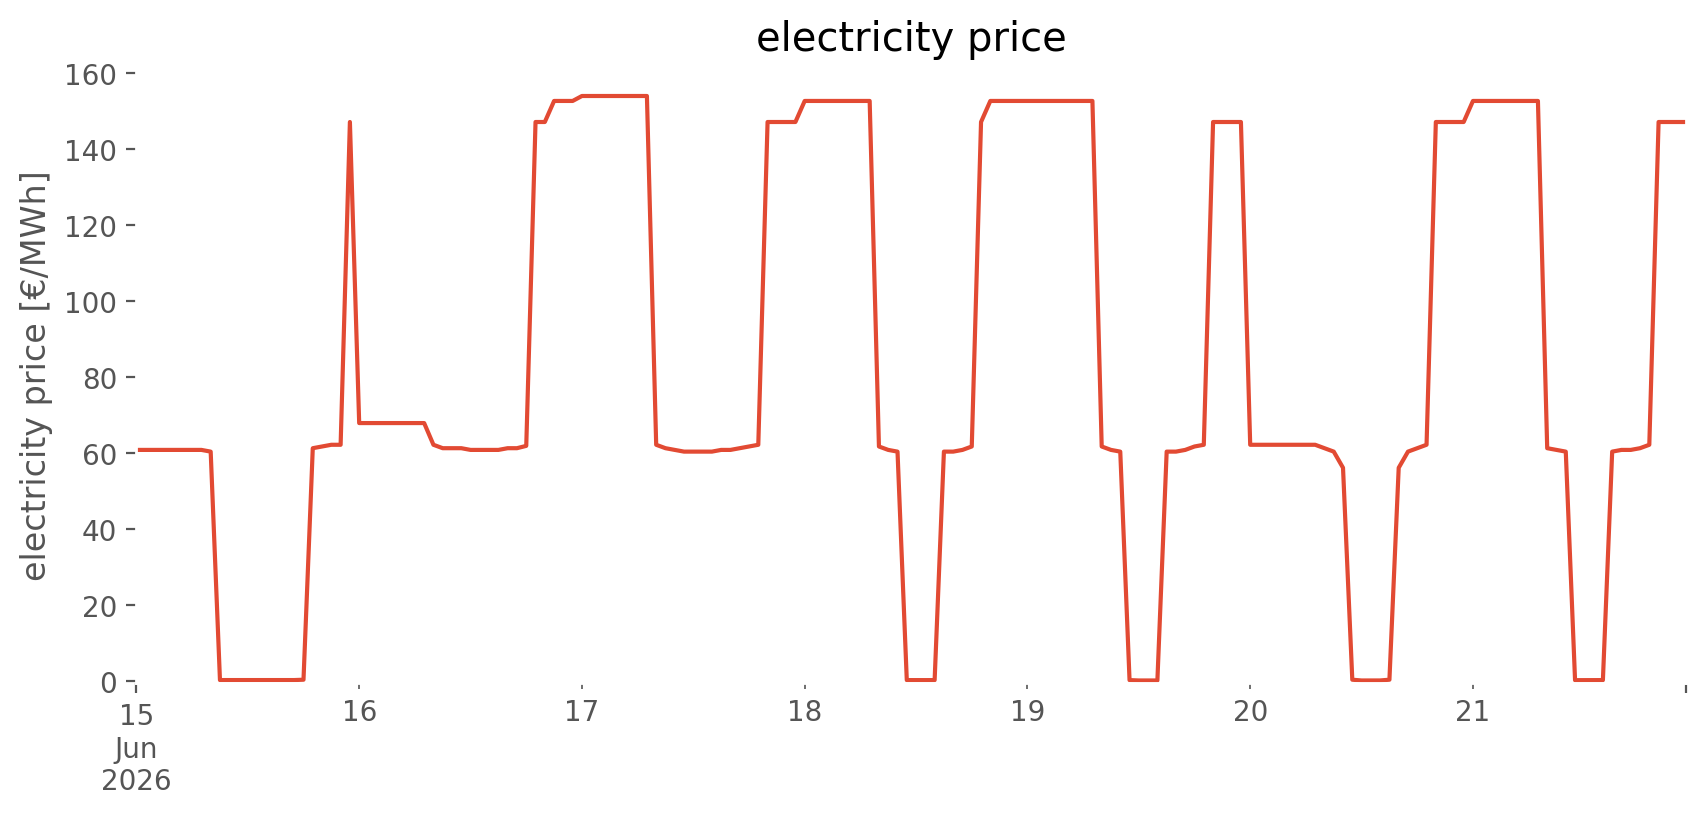
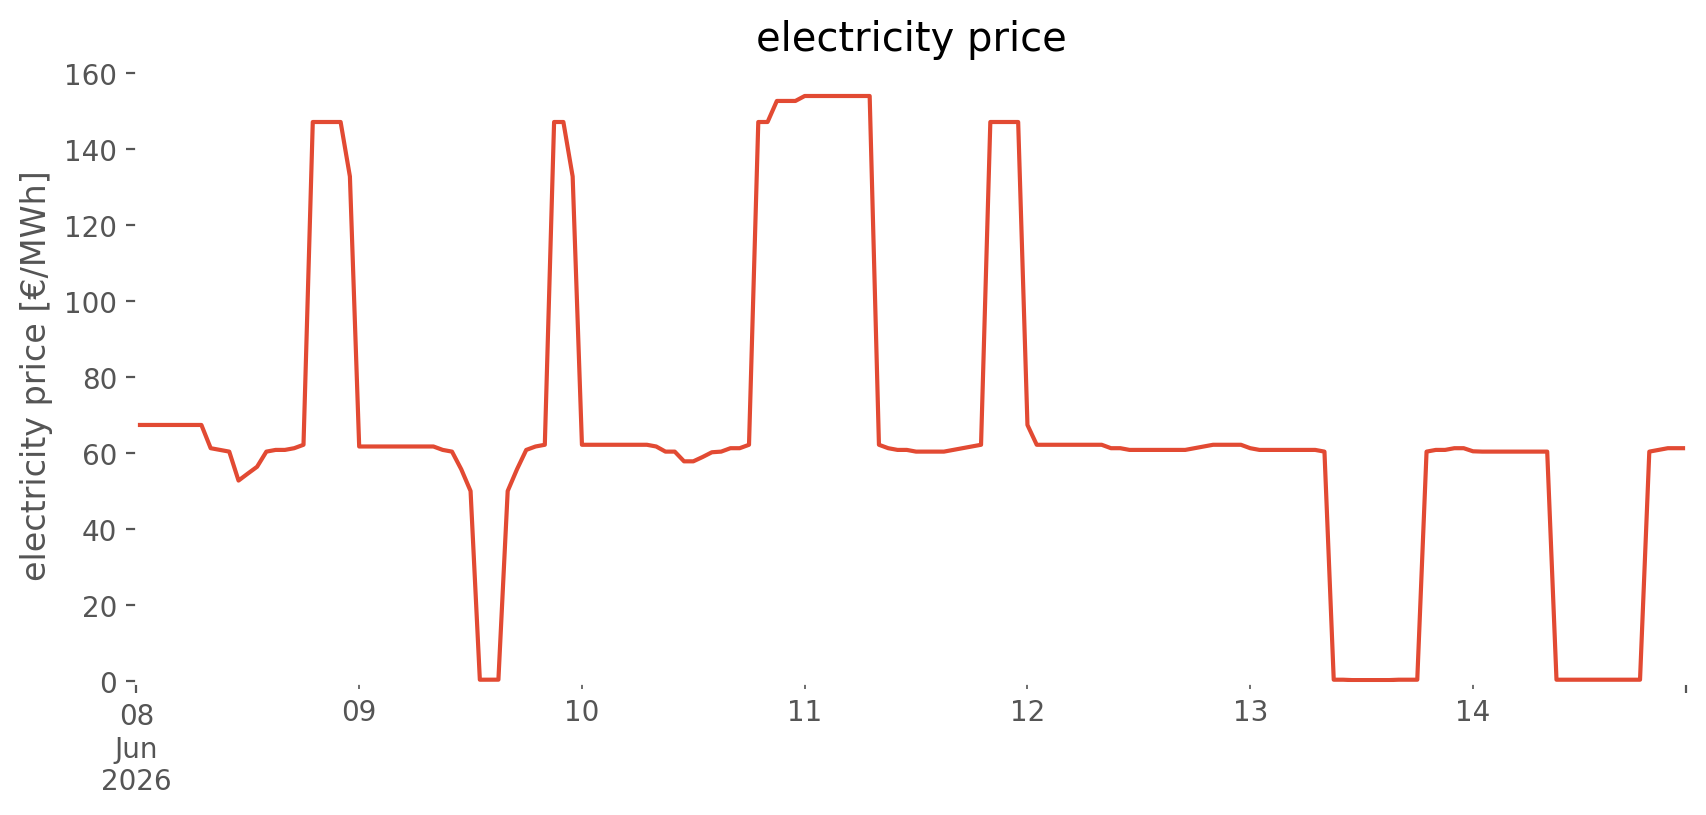
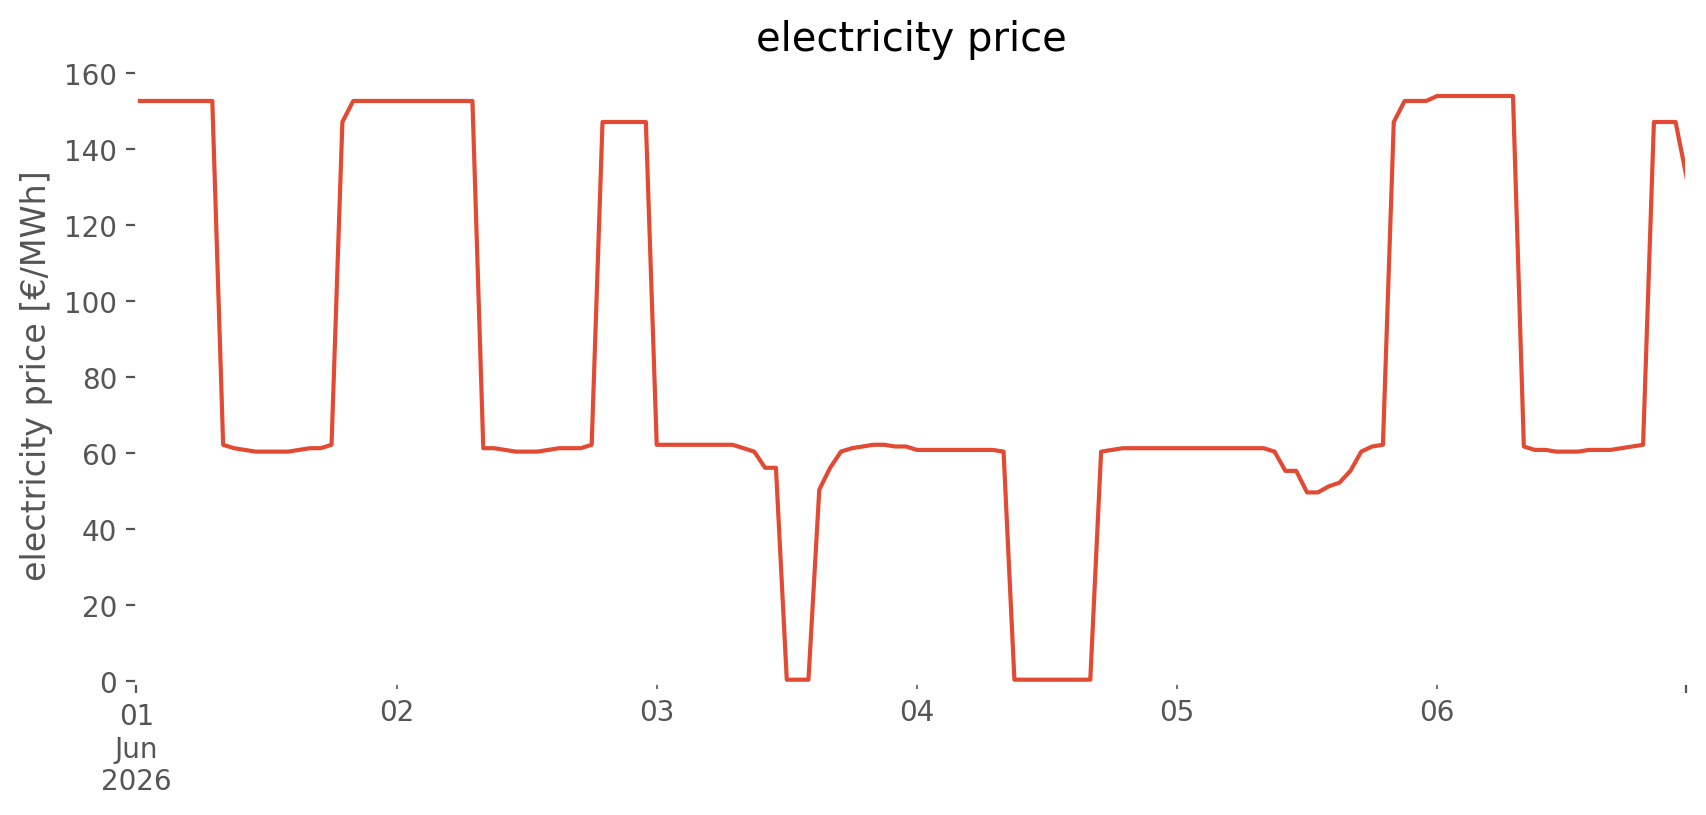
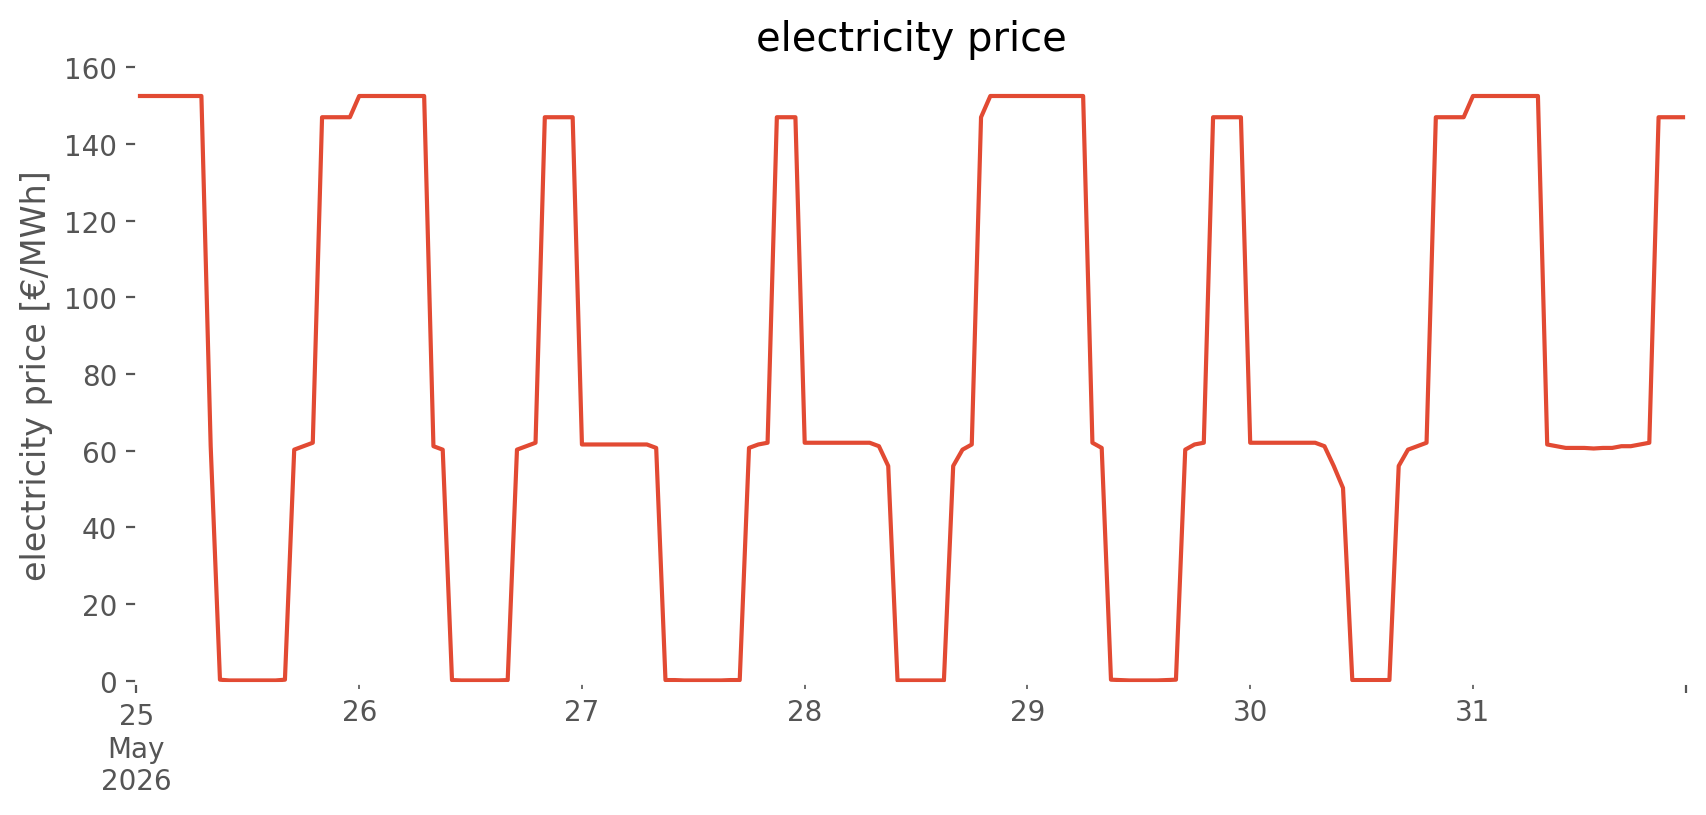
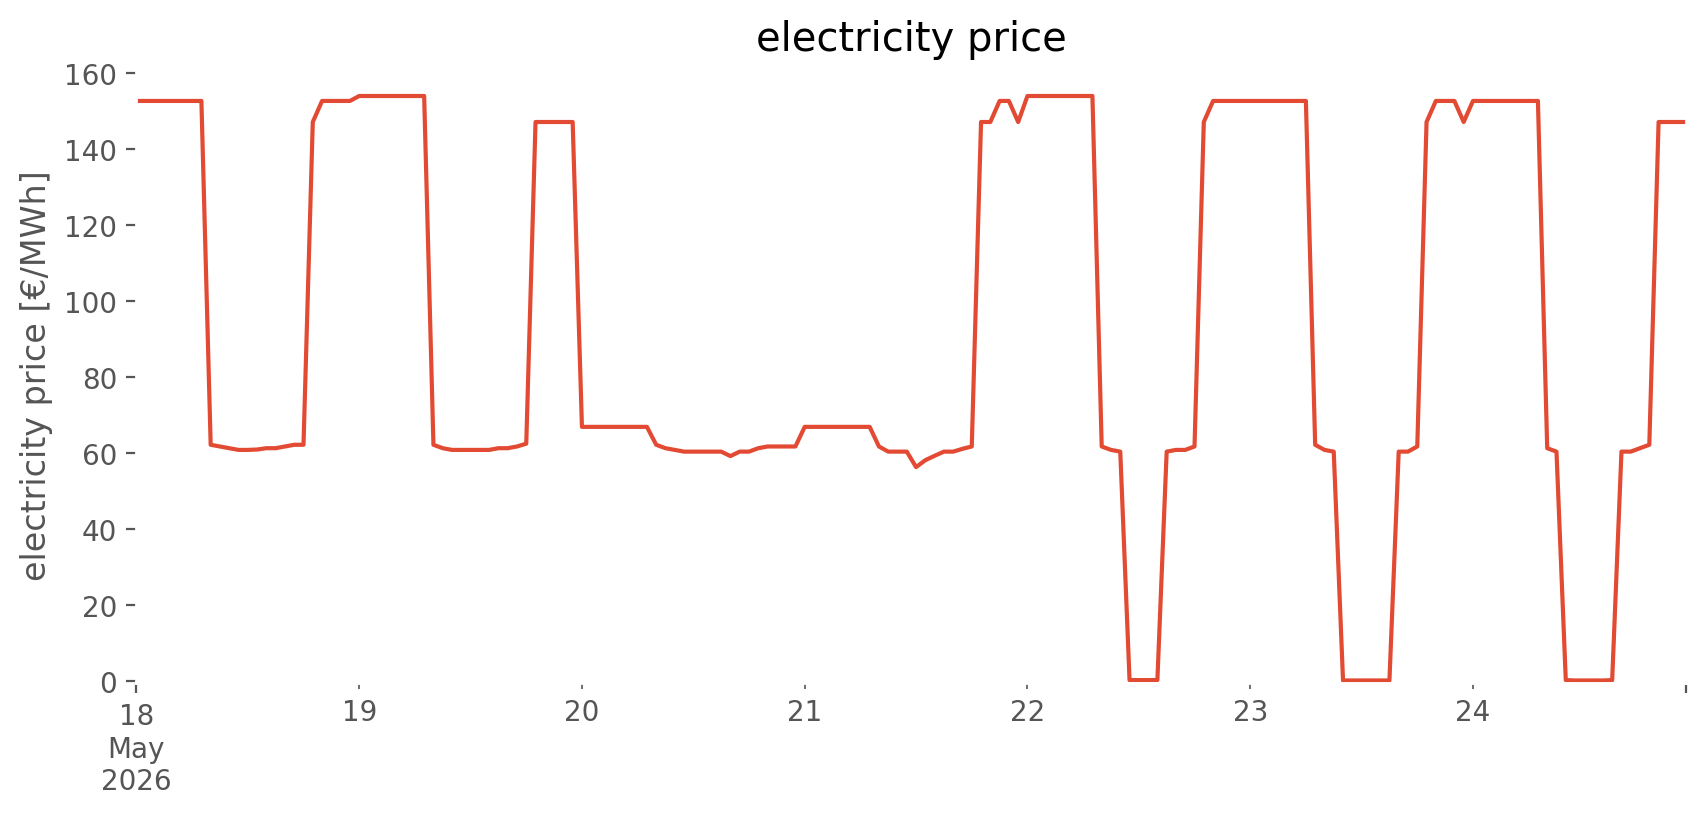
electricity mean price [€/MWh]: 89.24
System levelised cost for demand excluding storage [€/MWh]: 90.85
Past 10 weeks
Week 2026-29
Week 2026-28
Week 2026-27
Week 2026-26
Week 2026-25
Week 2026-24
Week 2026-23
Week 2026-22
Week 2026-21
Week 2026-20
Future capacities in DE
All units are GW for power, GWh for storage energy or million additional units for heat pumps and battery electric vehicles.| Technology | Future Capacity | Current Capacity | EEG Target 2030 | EEG Target 2040 |
|---|---|---|---|---|
| onshore | 200 | 68.1 | 115 | 160 |
| pv | 480 | 106.7 | 215 | 400 |
| offshore | 60 | 9.5 | 30 | 55-60 |
| hydro | 5 | 5.9 | ||
| pumped_hydro | 9.6 | 9.6 | ||
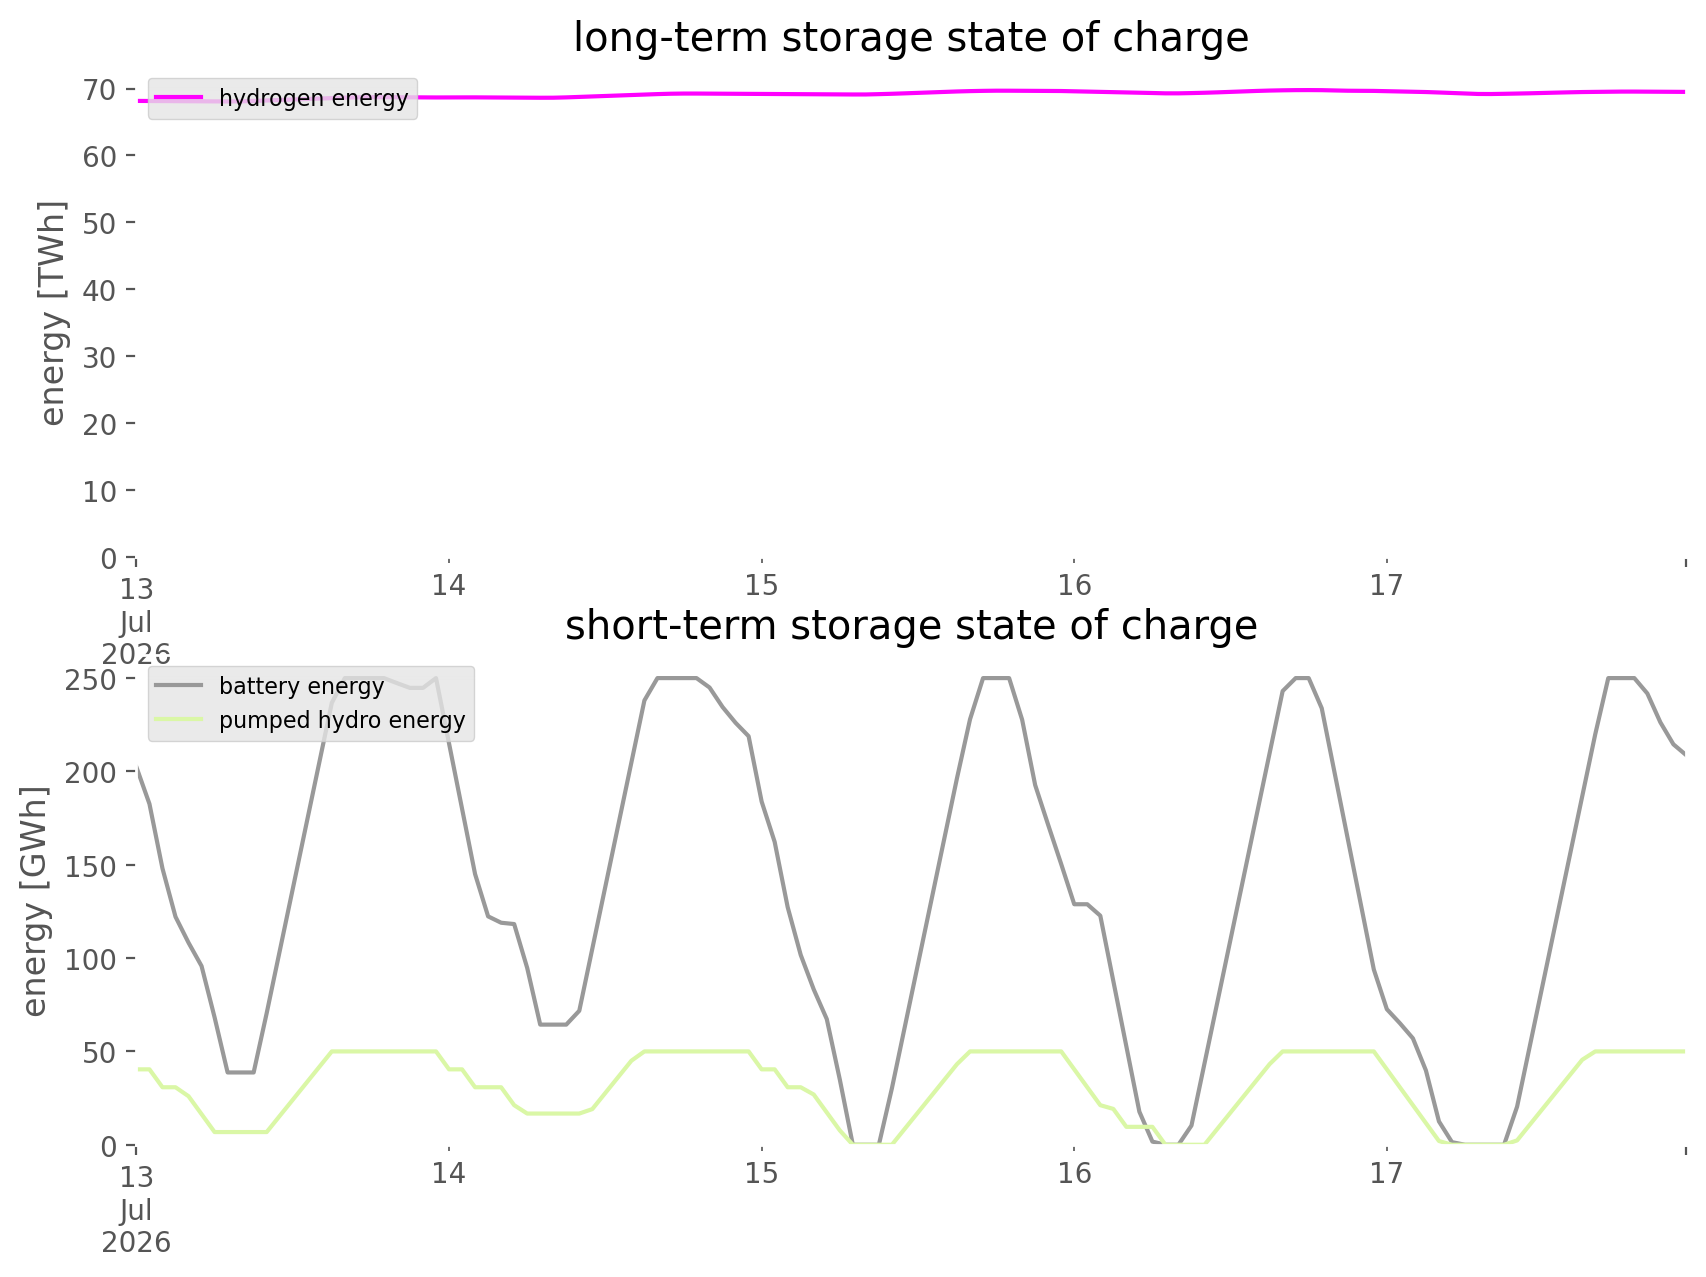
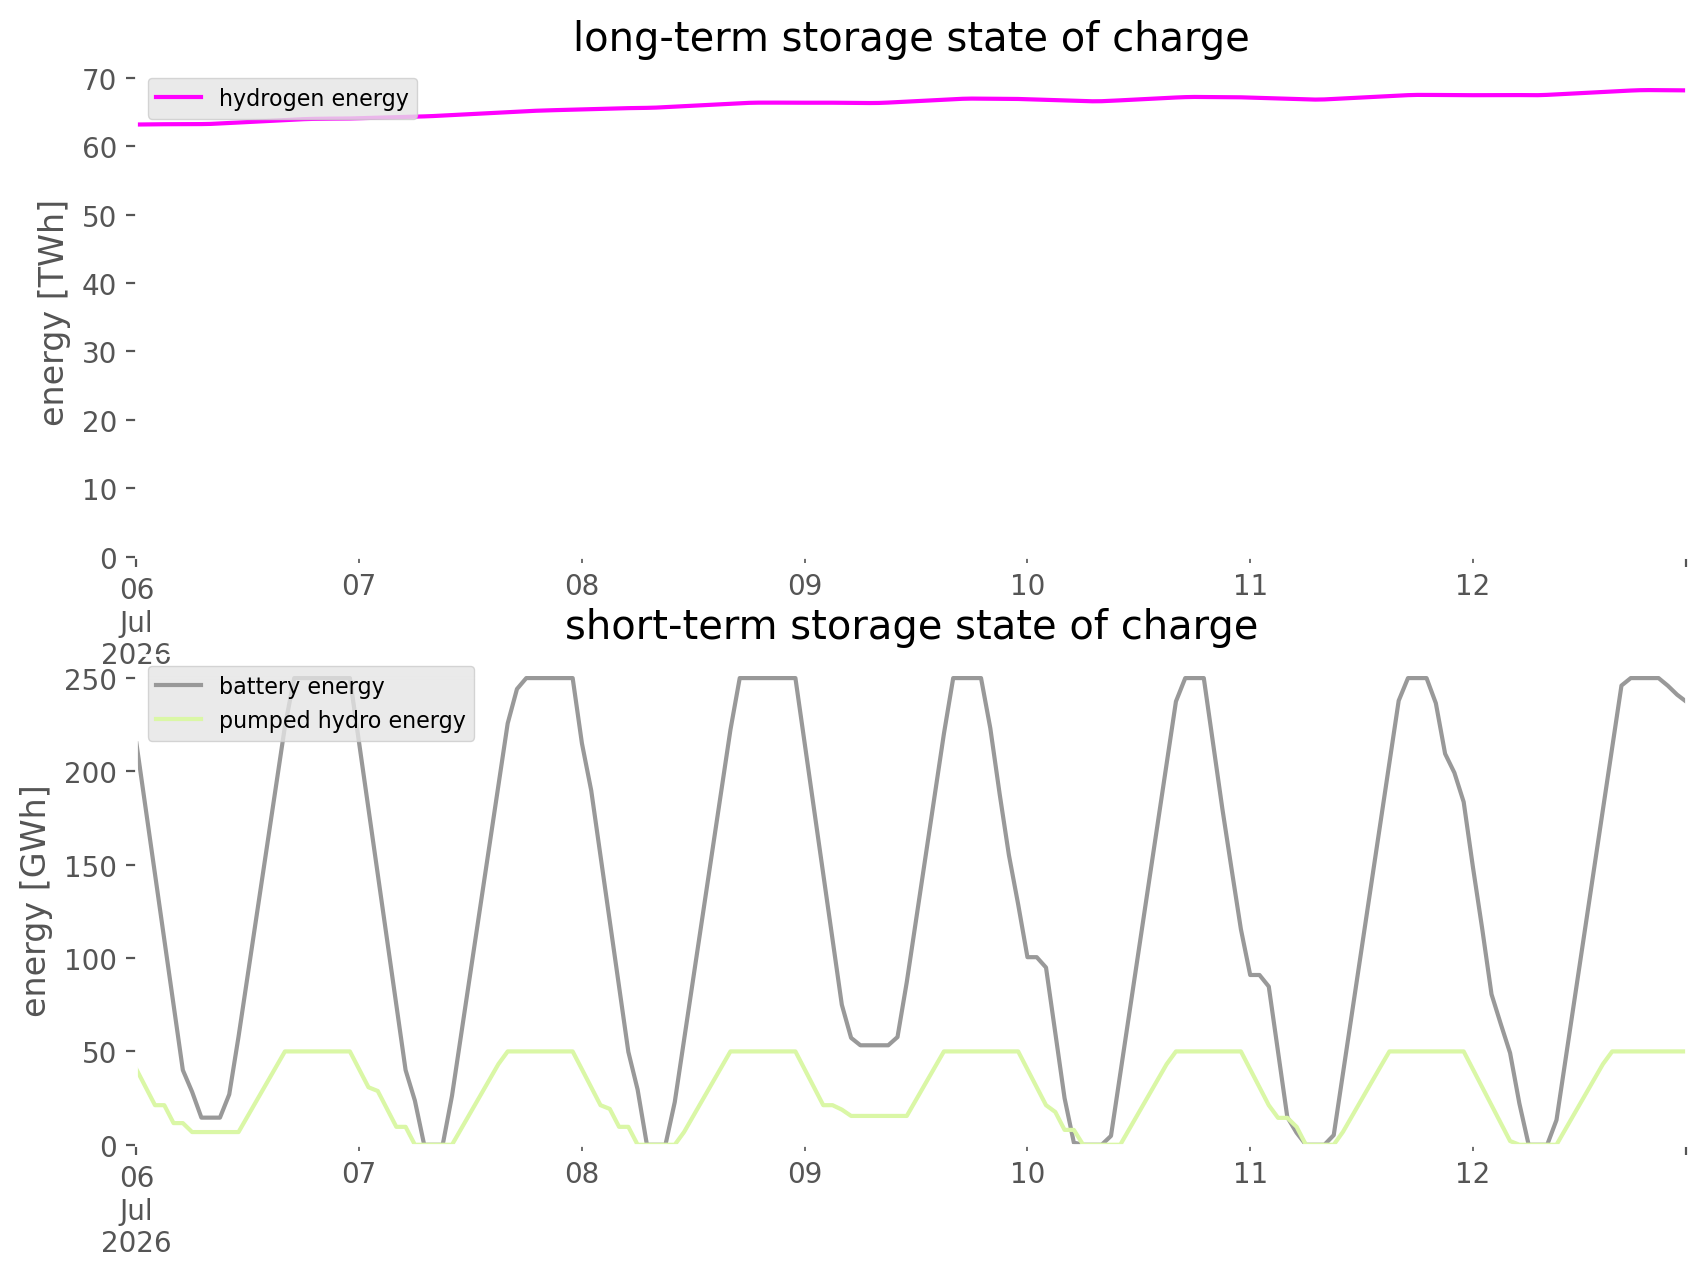
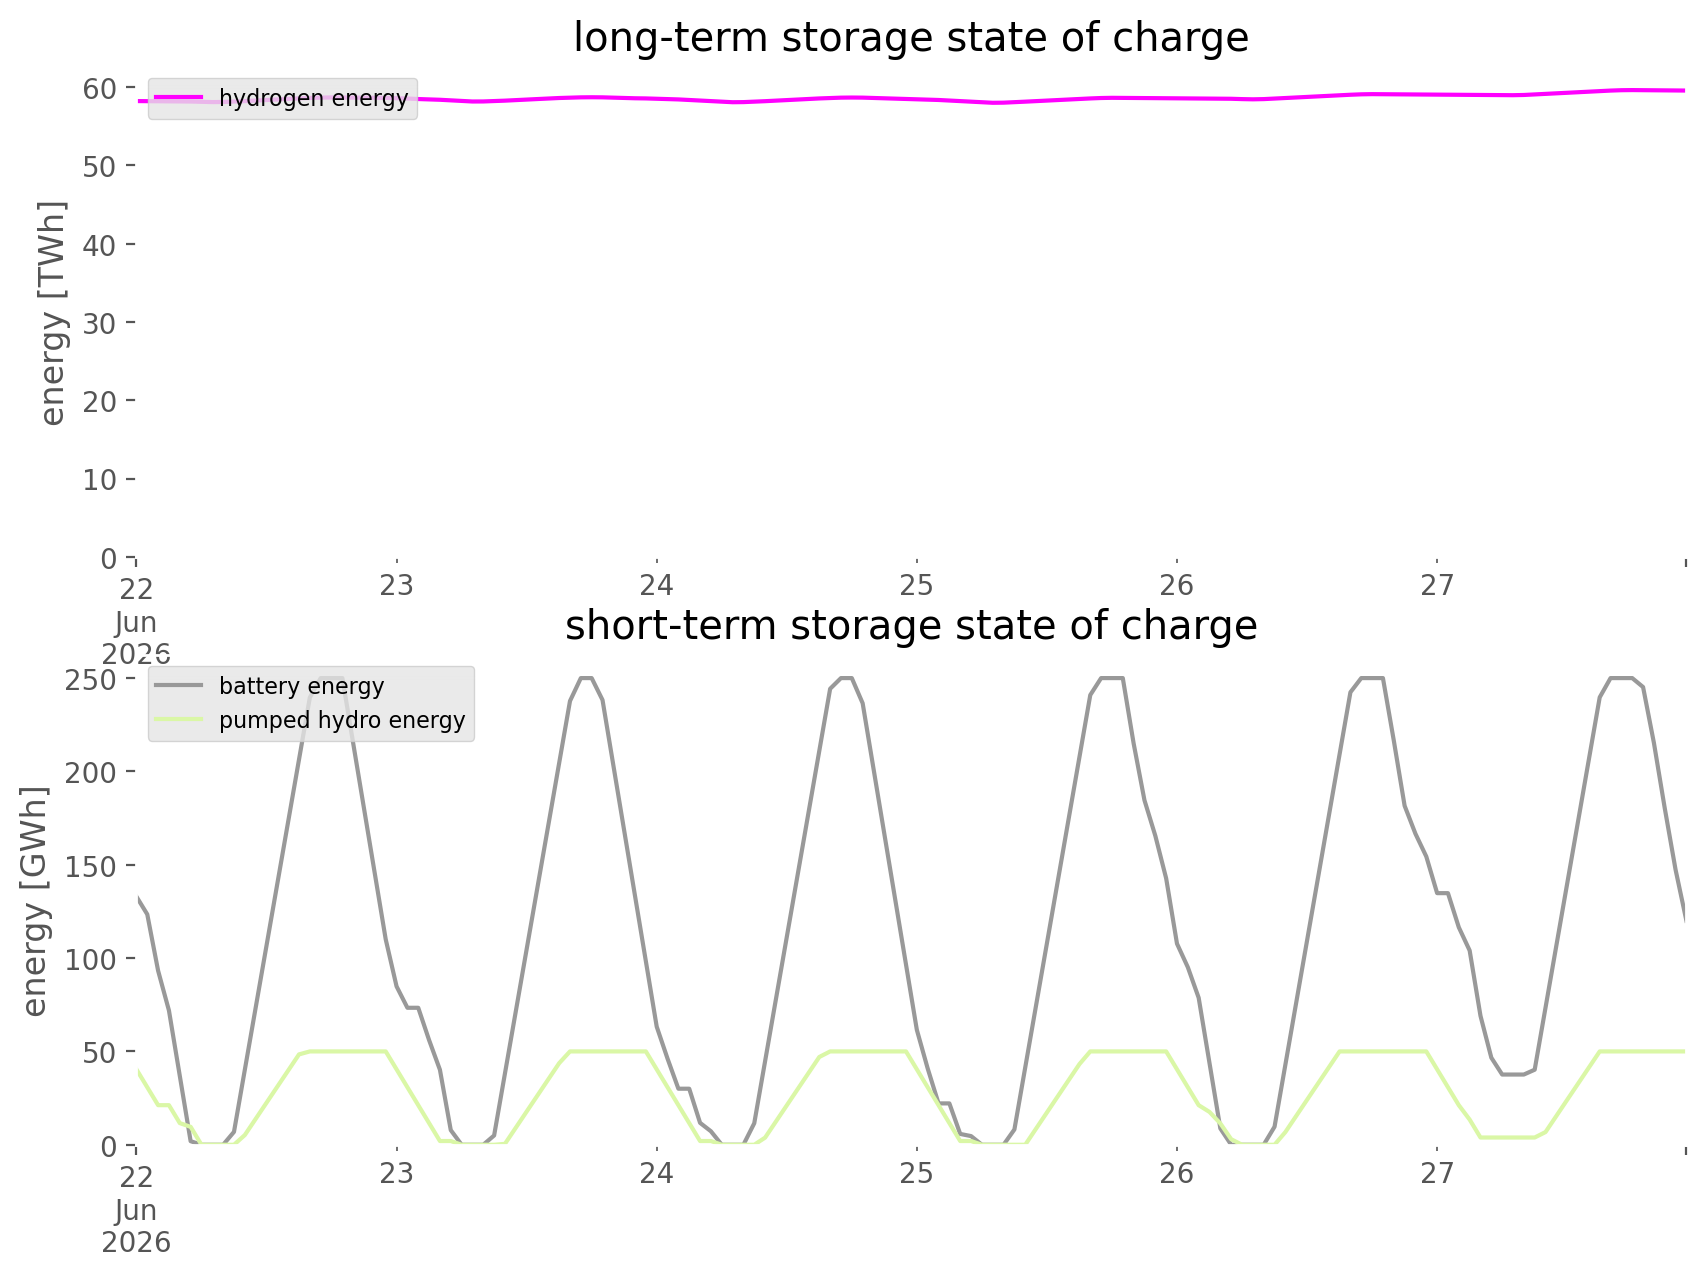
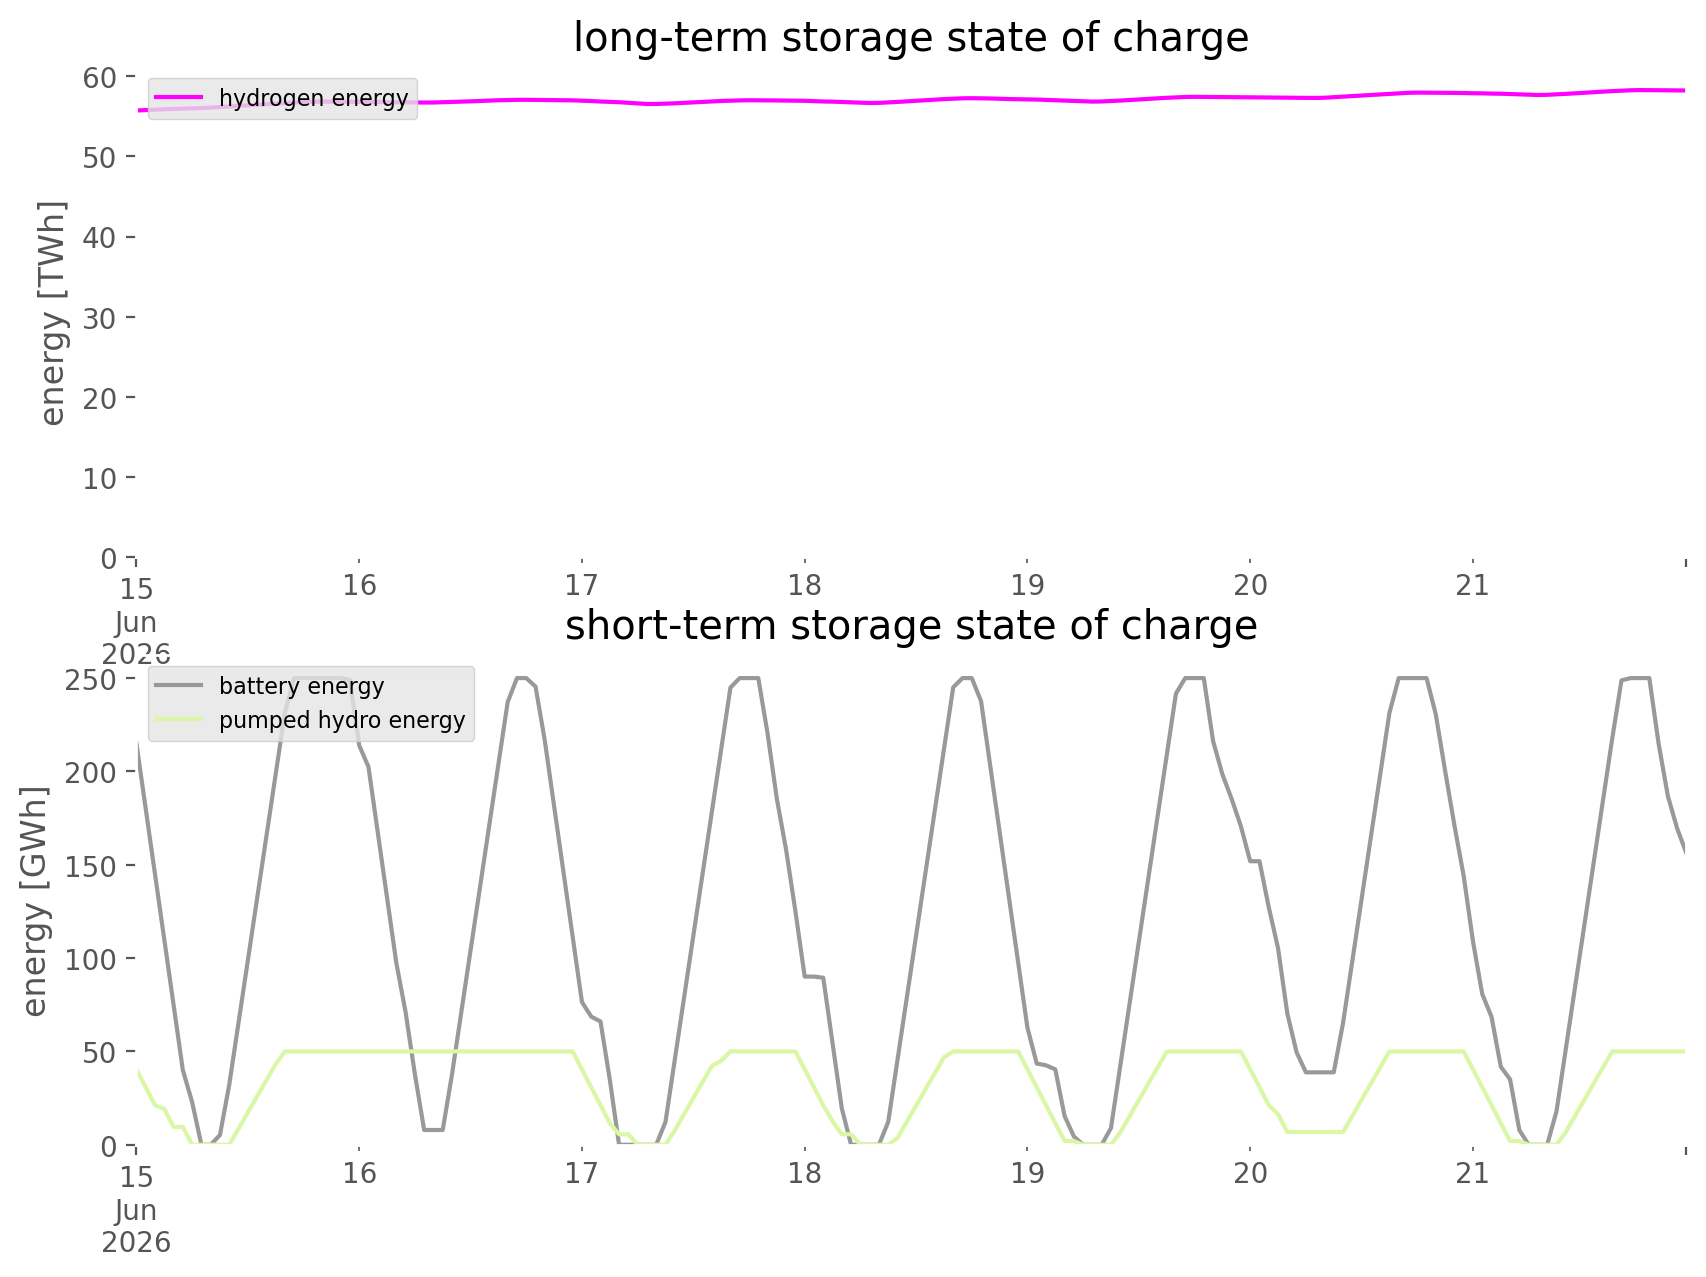
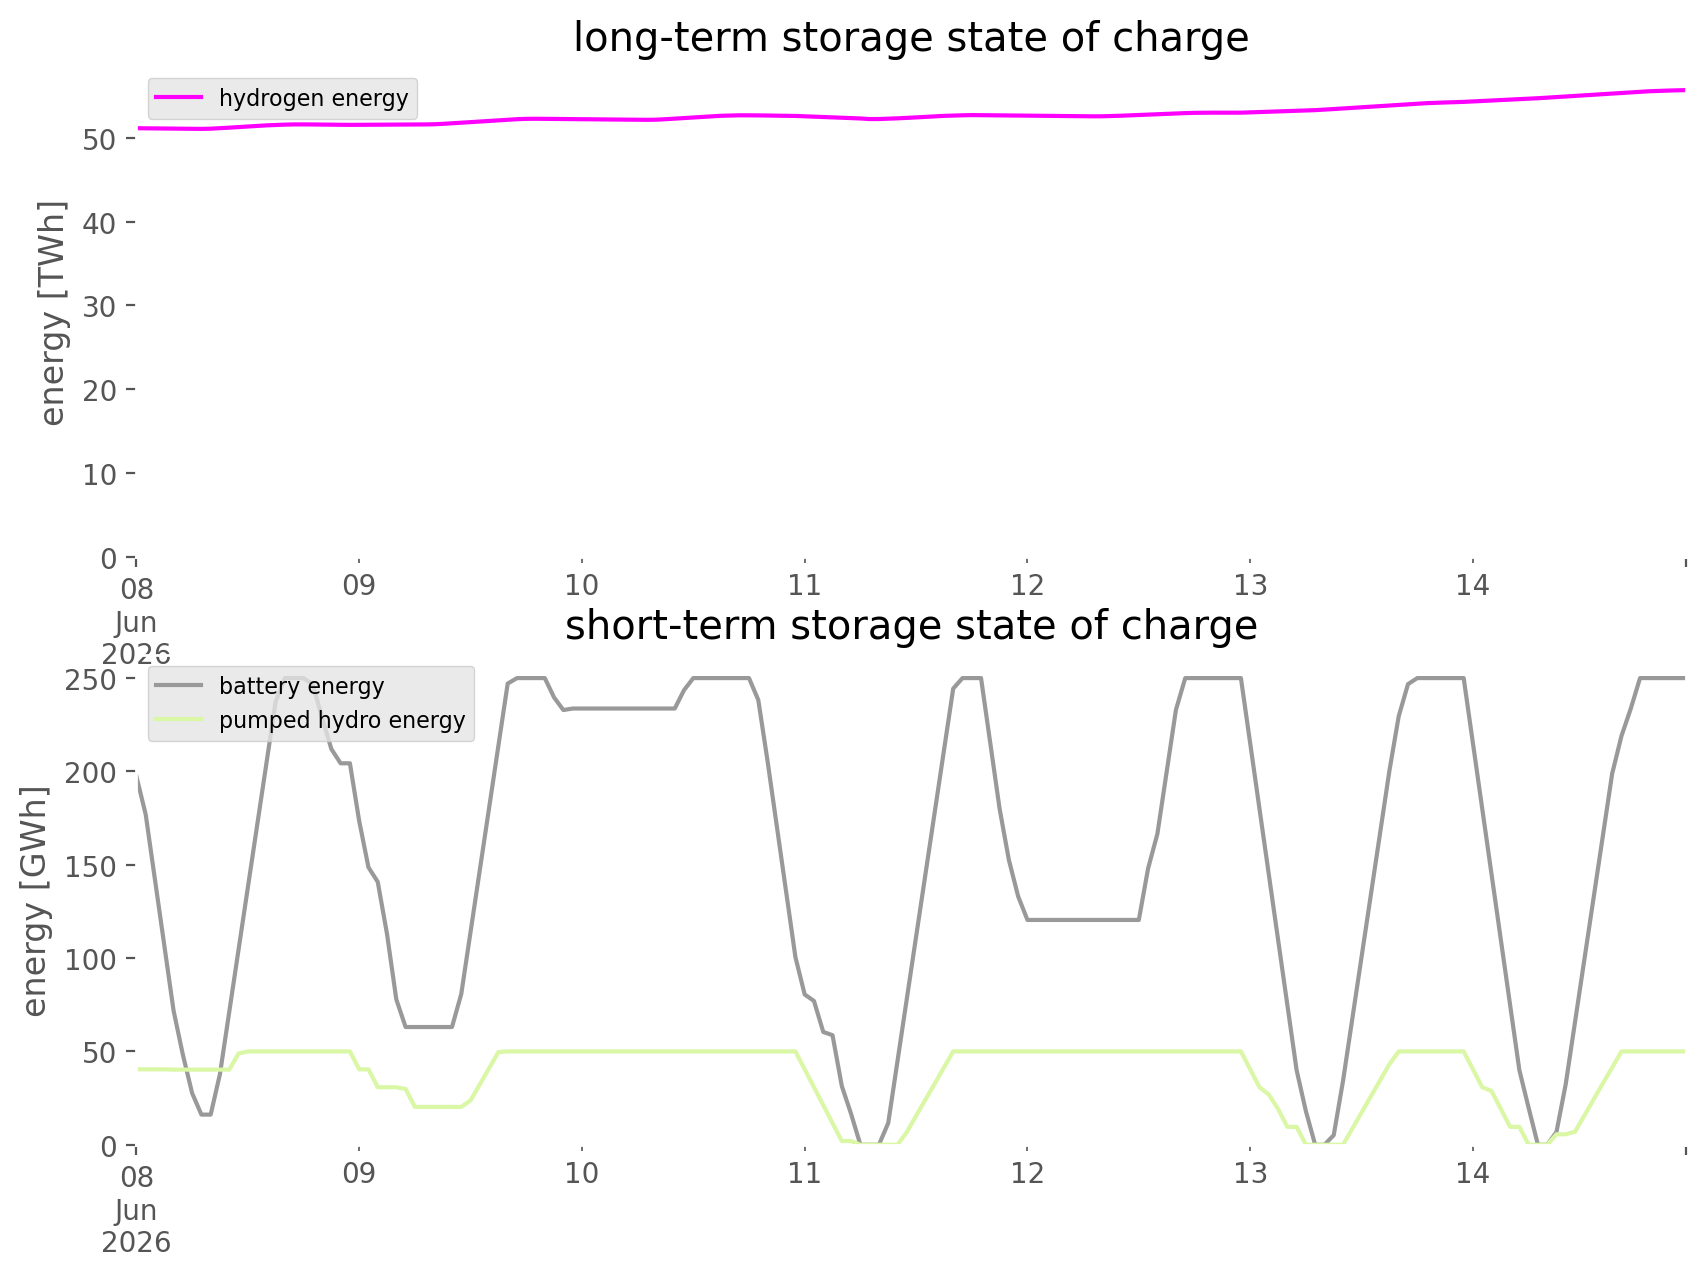
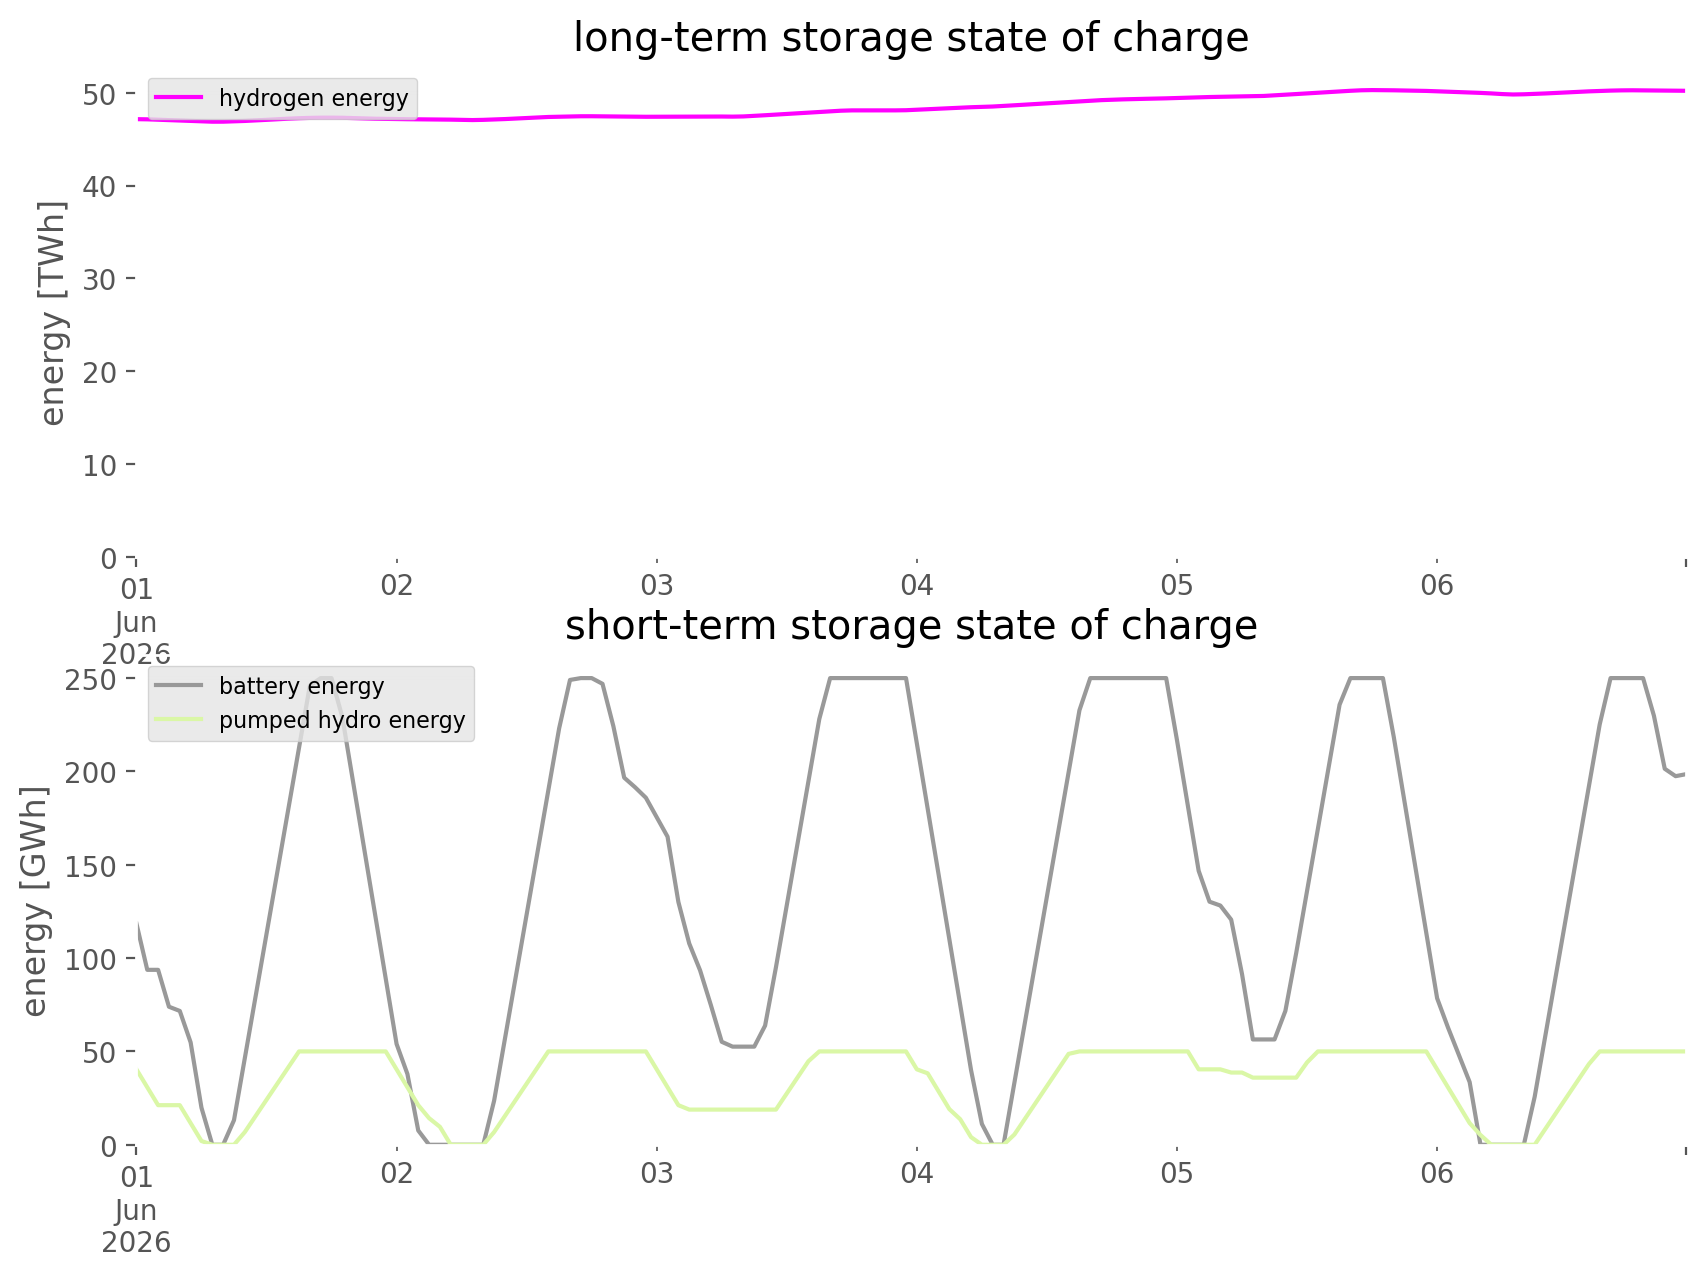
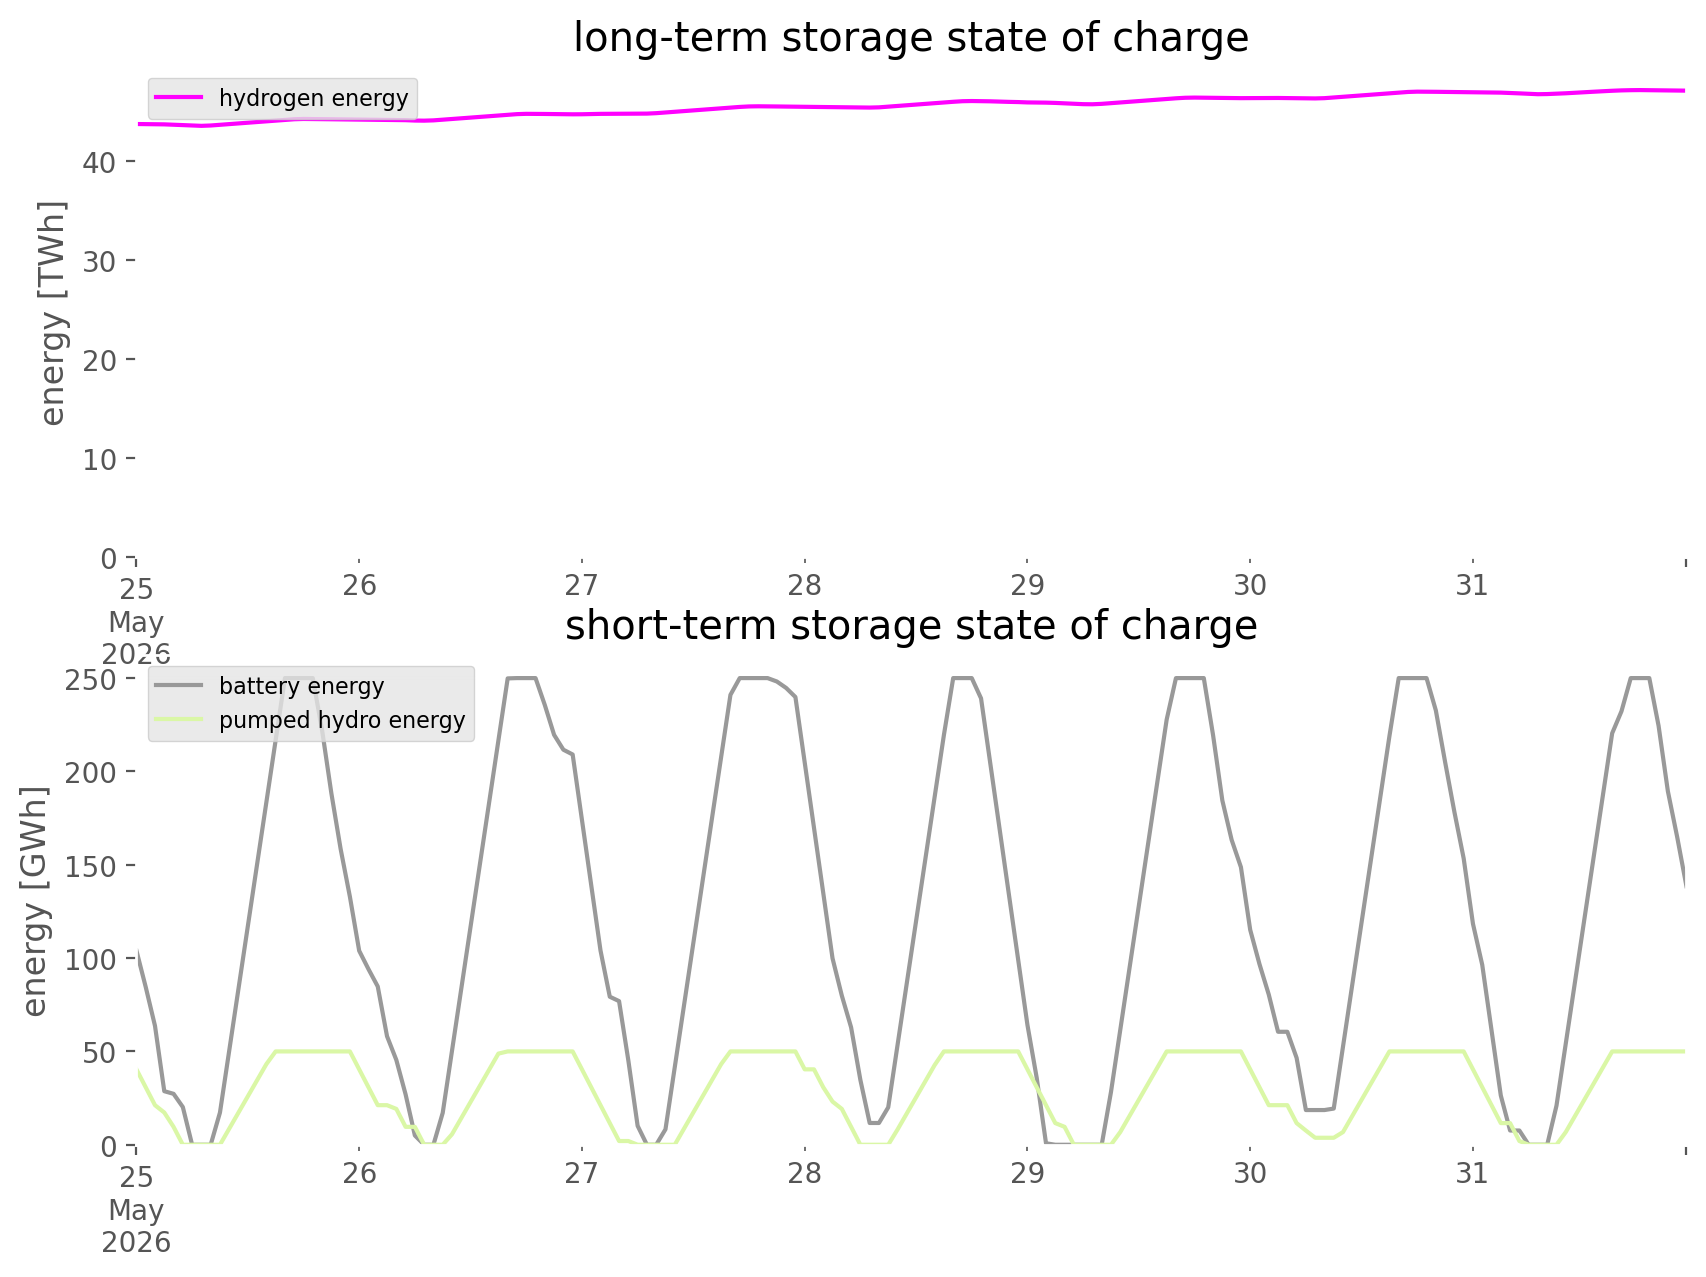
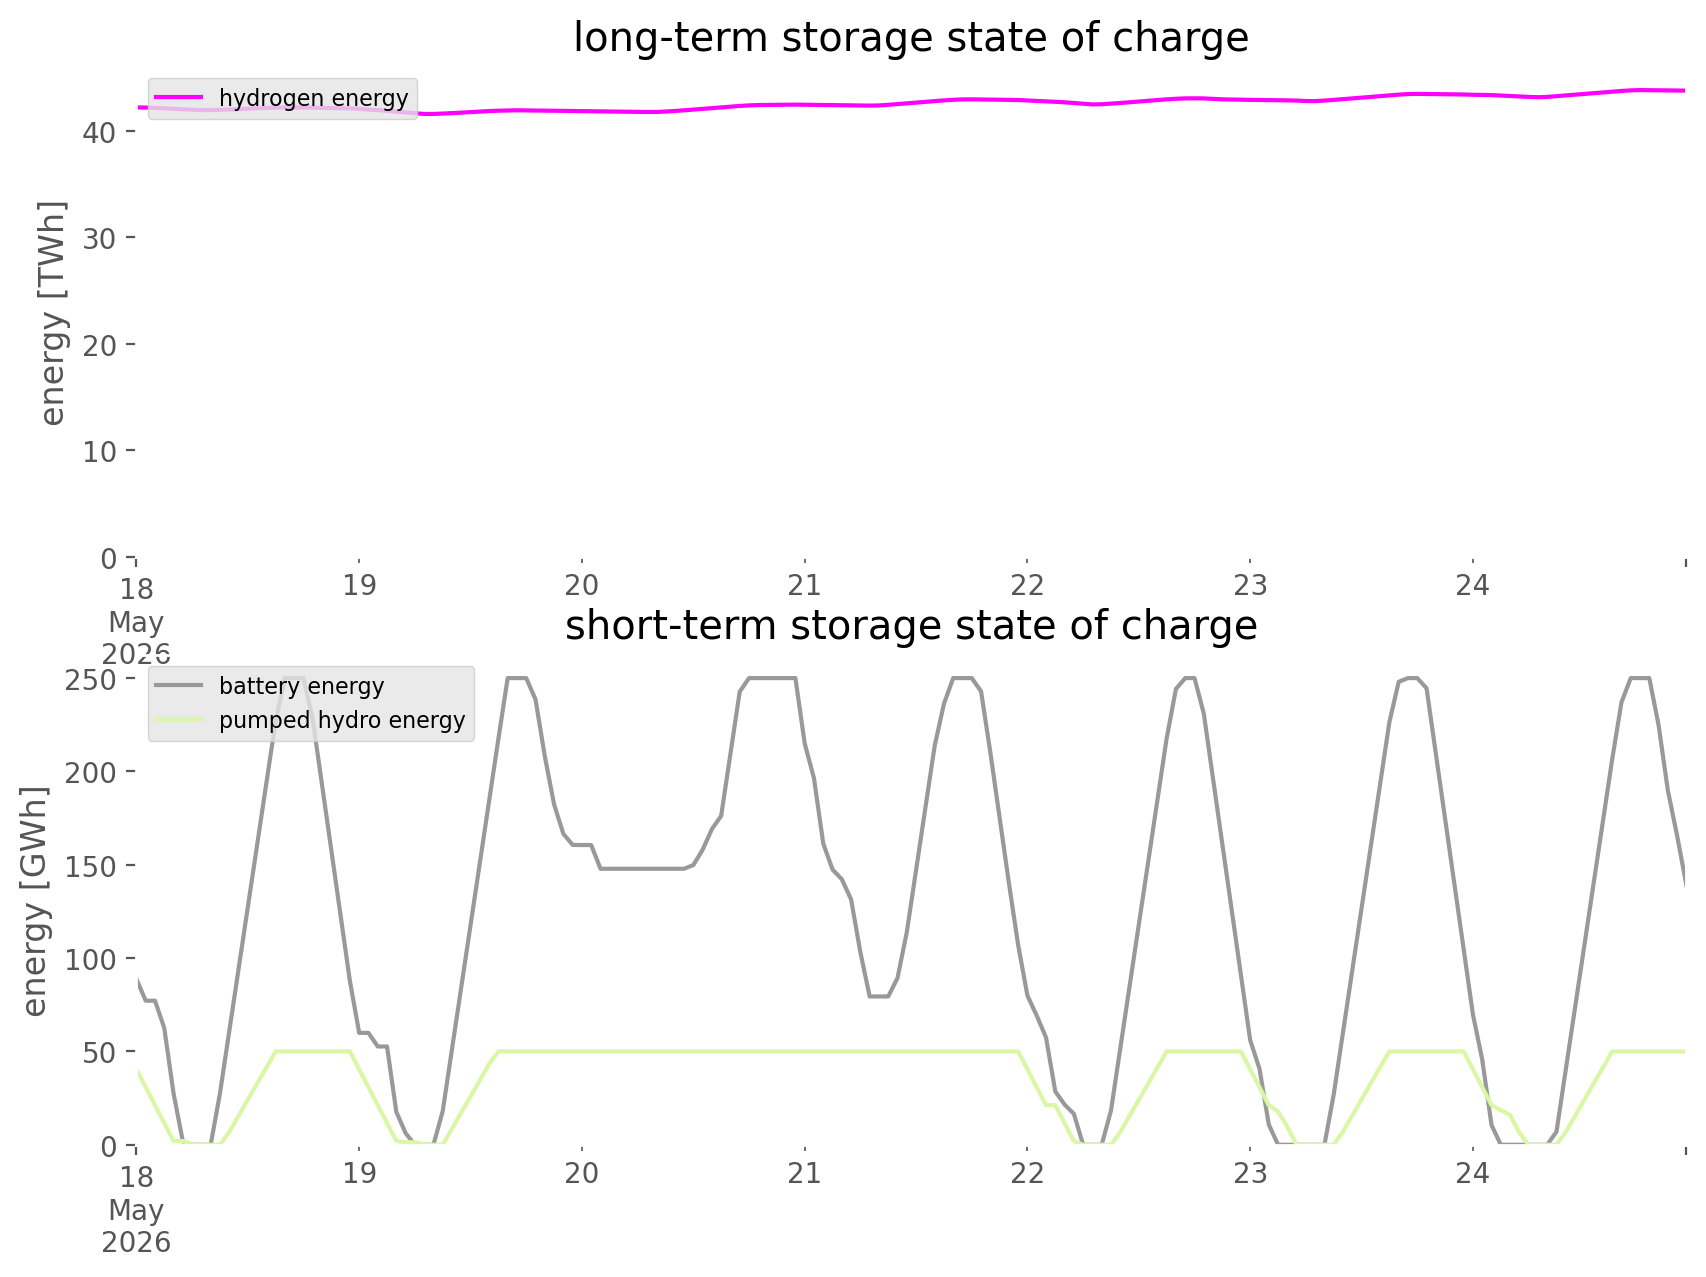
| pumped_hydro_energy | 50 | 50 | ||
| battery | 35 | 12.1 | ||
| battery_energy | 250 | 17.7 | ||
| hydrogen_electrolyser | 120 | <1 | ||
| hydrogen_turbine | 90 | 0 | ||
| hydrogen_energy | 160000 | <1 | ||
| hydrogen_demand | 11.4077 | |||
| heat_pumps | 15 | |||
| battery_electric_vehicles | 30 |
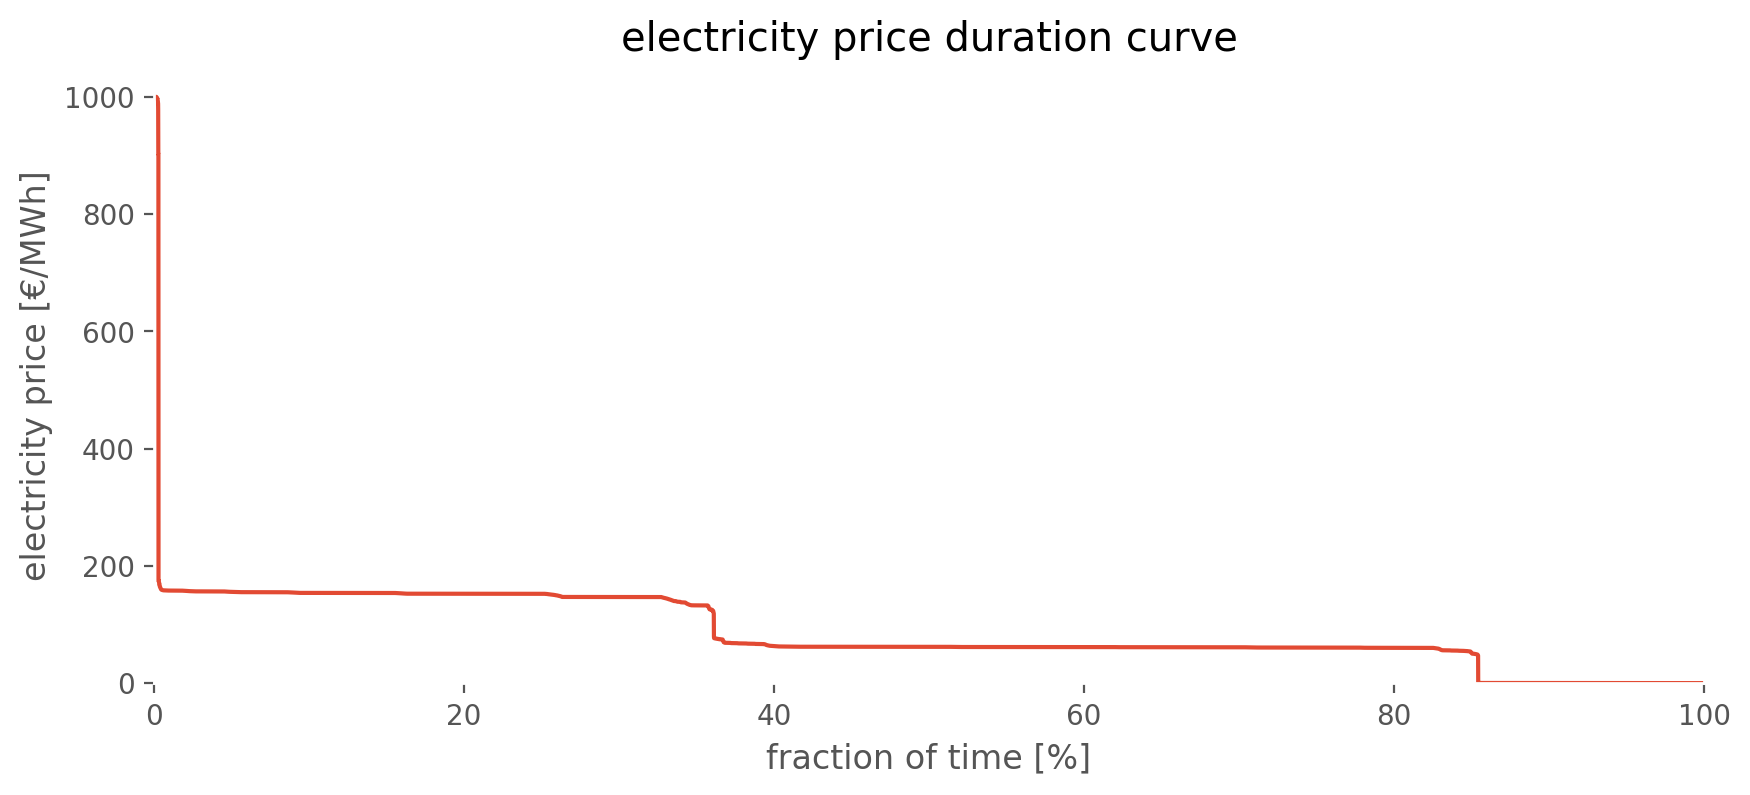
Constant hydrogen value: 90.0 €/MWhLHV; Value of lost load: 1000.0 €/MWh. All costs and prices are in 2020 euros. Fuel energy refers to the lower heating value (LHV).
Aggregated yearly statistics
All costs and prices are in 2020 euros. Fuel energy refers to the lower heating value (LHV). Annuities are calculated with 2030 cost assumptions and a weighted average cost of capital (WACC) of 7%.
| Statistic | value |
|---|---|
| electricity mean price [€/MWh] | 89.24 |
| onshore capacity [GW] | 200.00 |
| pv capacity [GW] | 480.00 |
| offshore capacity [GW] | 60.00 |
| hydro capacity [GW] | 5.00 |
| pumped_hydro capacity [GW] | 9.60 |
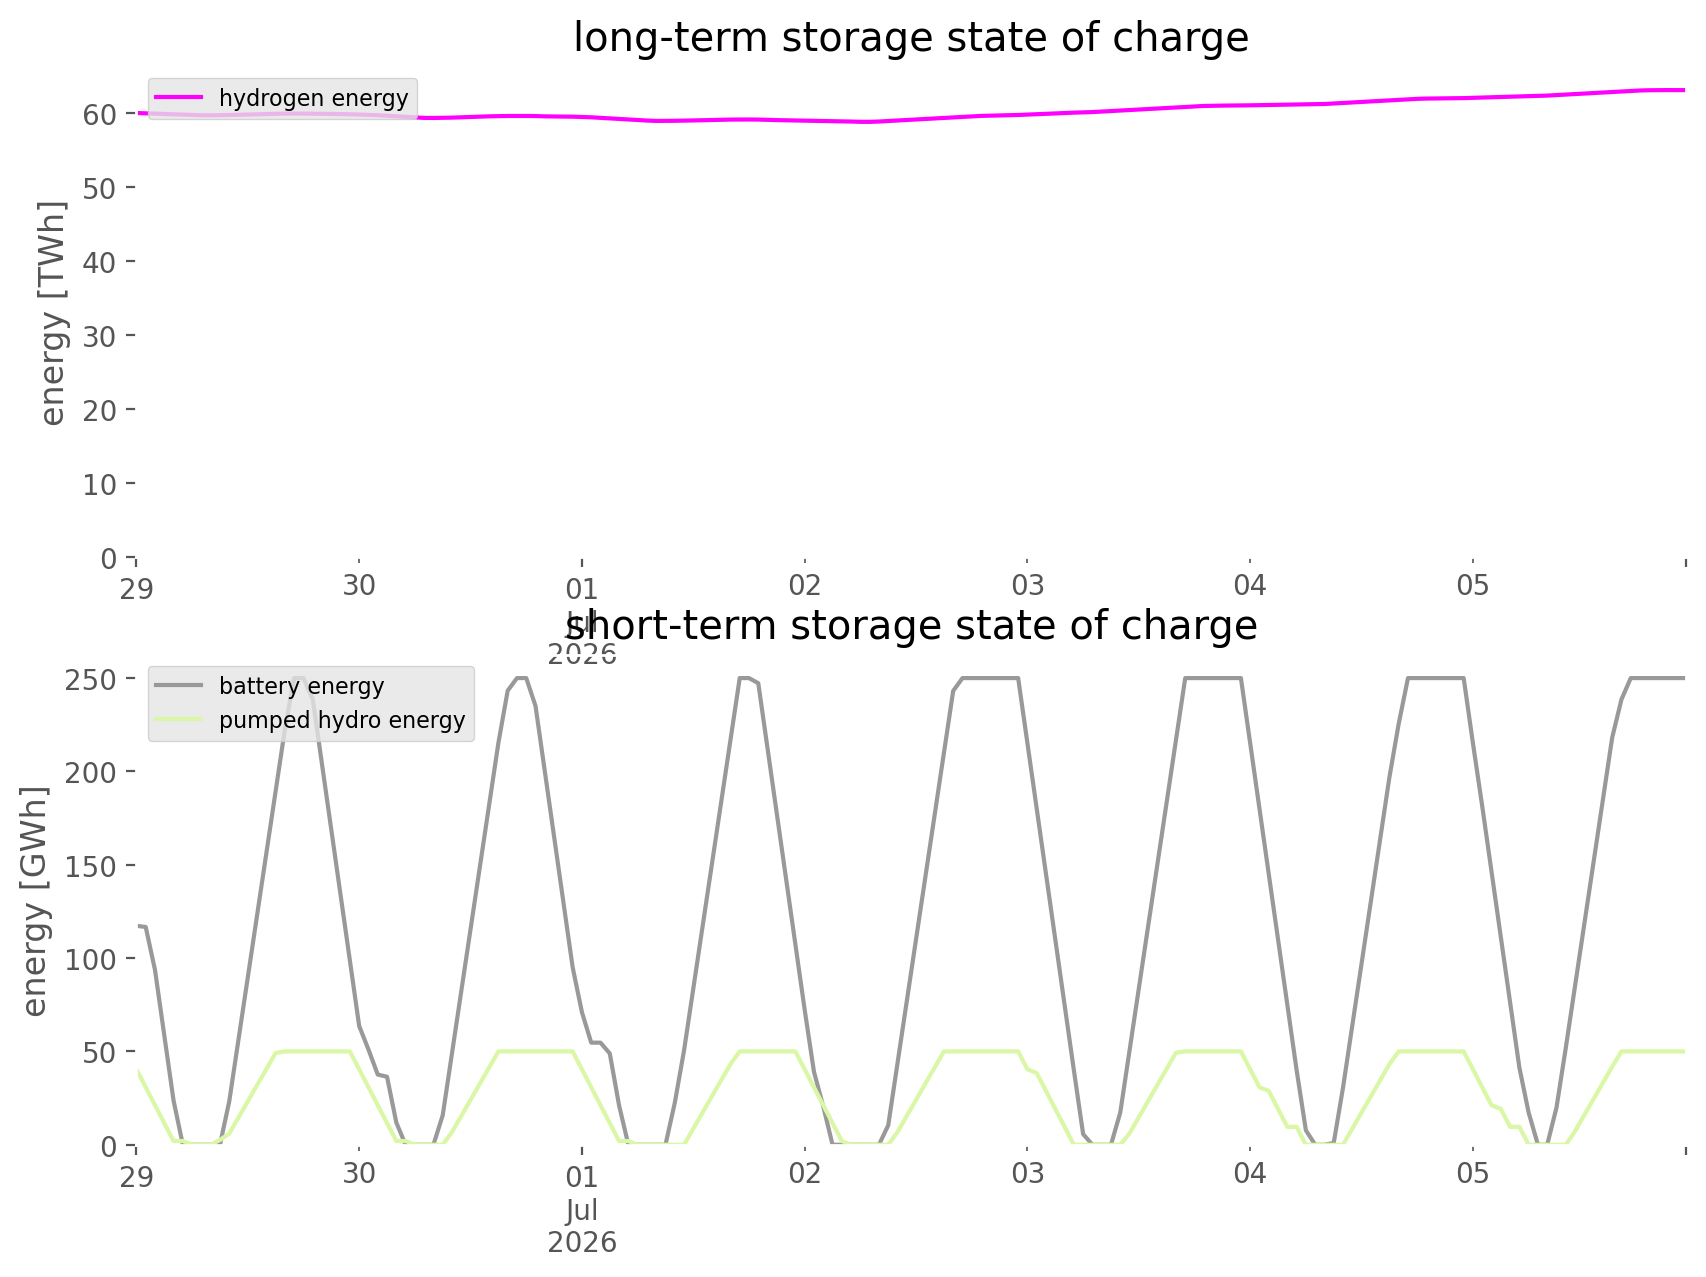
| pumped_hydro_energy capacity [GWh] | 50.00 |
| battery capacity [GW] | 35.00 |
| battery_energy capacity [GWh] | 250.00 |
| hydrogen_electrolyser capacity [GW] | 120.00 |
| hydrogen_turbine capacity [GW] | 90.00 |
| hydrogen_energy capacity [GWh] | 160000.00 |
| hydrogen_demand capacity [GW] | 11.41 |
| heat_pumps capacity [GW] | 15.00 |
| battery_electric_vehicles capacity [GW] | 30.00 |
| battery yearly fixed costs [M€/a] | 901.17 |
| battery_electric_vehicles yearly fixed costs [M€/a] | 0.00 |
| battery_energy yearly fixed costs [M€/a] | 3363.33 |
| heat_pumps yearly fixed costs [M€/a] | 0.00 |
| hydro yearly fixed costs [M€/a] | 1651.38 |
| hydrogen_demand yearly fixed costs [M€/a] | 0.00 |
| hydrogen_electrolyser yearly fixed costs [M€/a] | 5431.67 |
| hydrogen_energy yearly fixed costs [M€/a] | 2475.99 |
| hydrogen_ocgt yearly fixed costs [M€/a] | 0.00 |
| hydrogen_turbine yearly fixed costs [M€/a] | 9839.62 |
| offshore yearly fixed costs [M€/a] | 10473.37 |
| onshore yearly fixed costs [M€/a] | 21209.80 |
| pumped_hydro yearly fixed costs [M€/a] | 1879.71 |
| pumped_hydro_energy yearly fixed costs [M€/a] | 0.00 |
| pv yearly fixed costs [M€/a] | 18376.02 |
| total yearly fixed costs [M€/a] | 75602.07 |
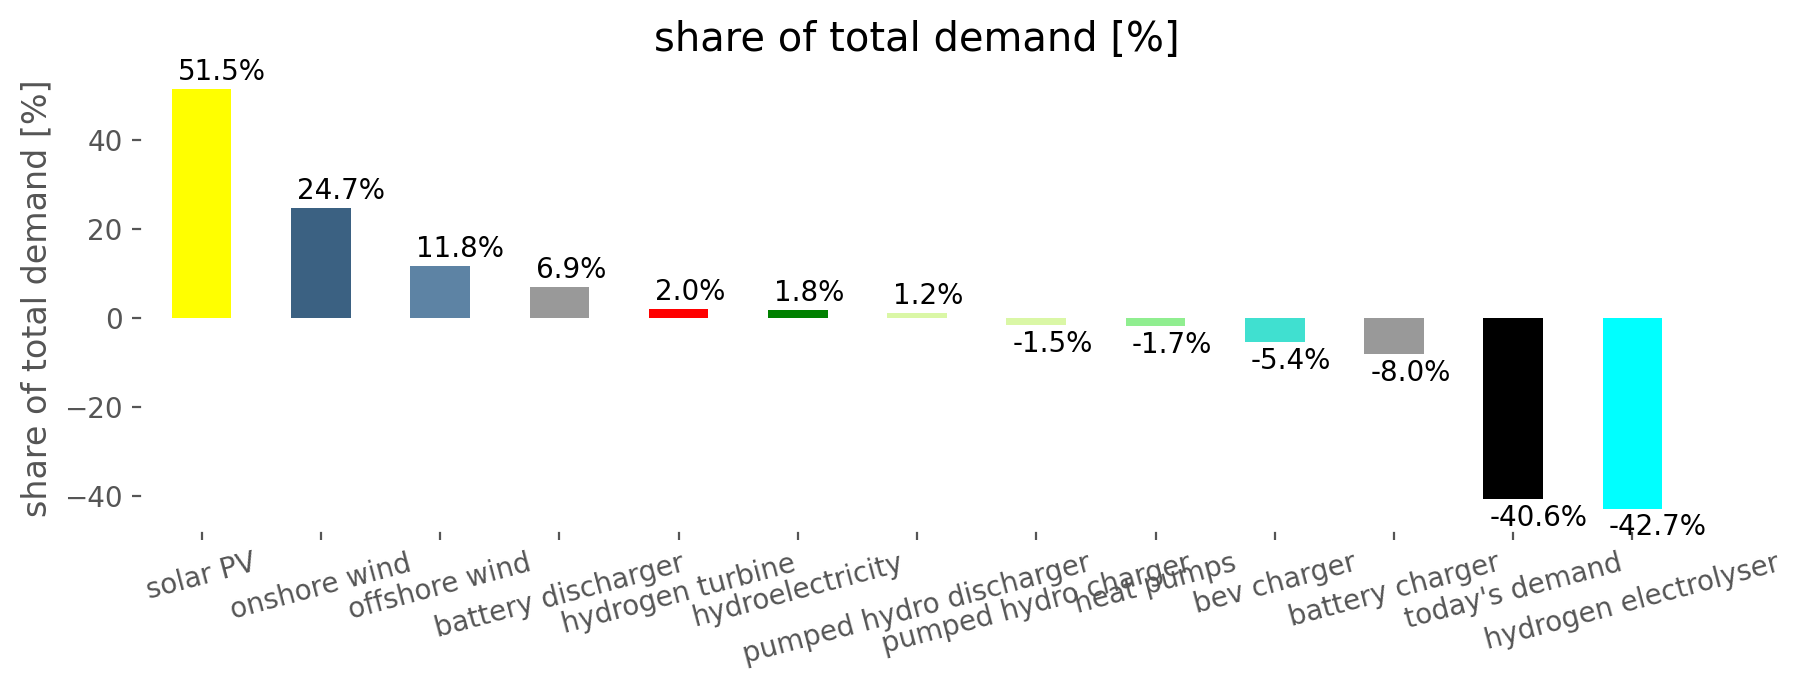
| hydroelectricity yearly dispatch [TWh/a] | 21.29 |
| load shedding yearly dispatch [TWh/a] | 0.15 |
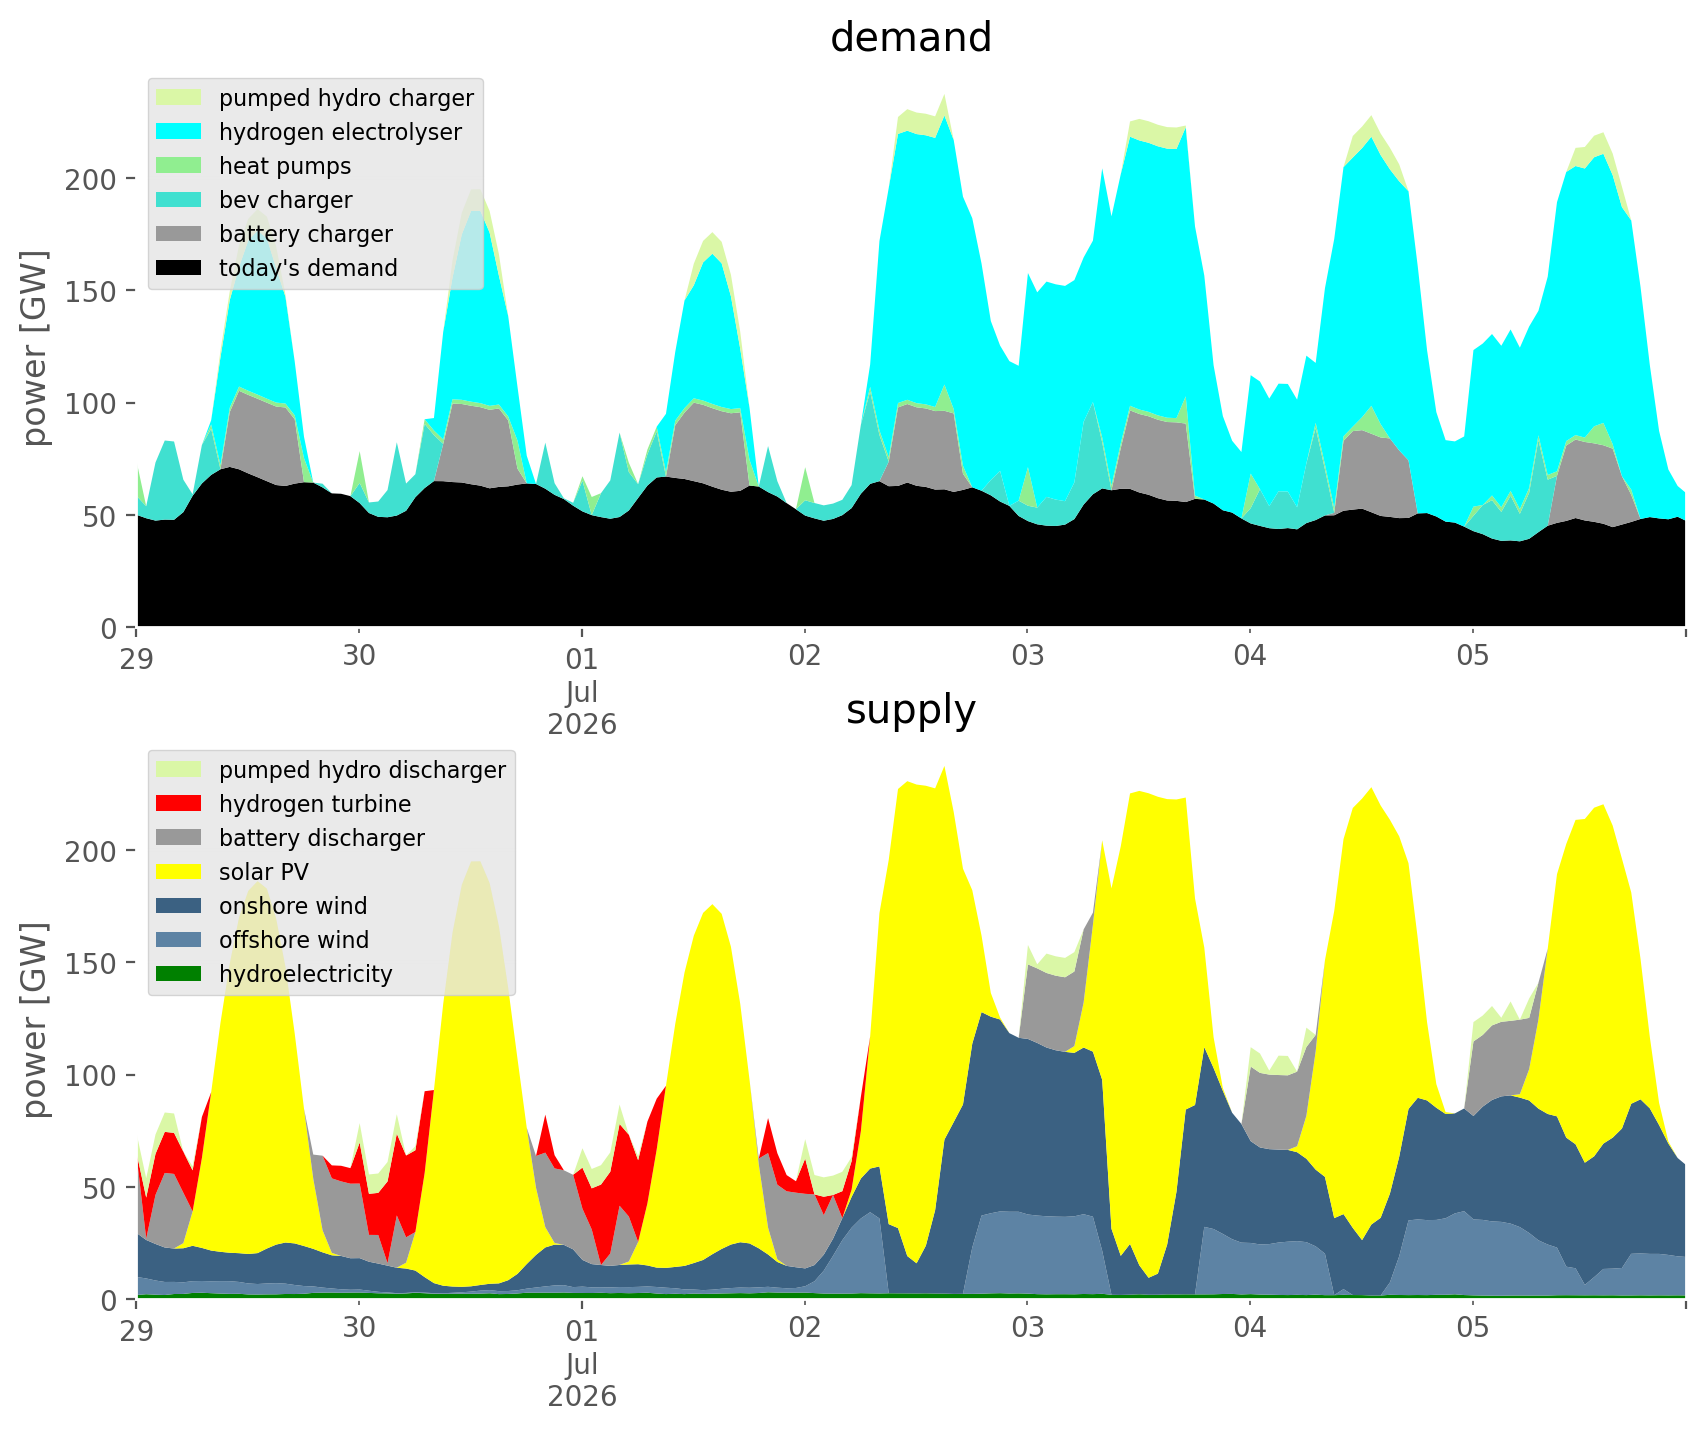
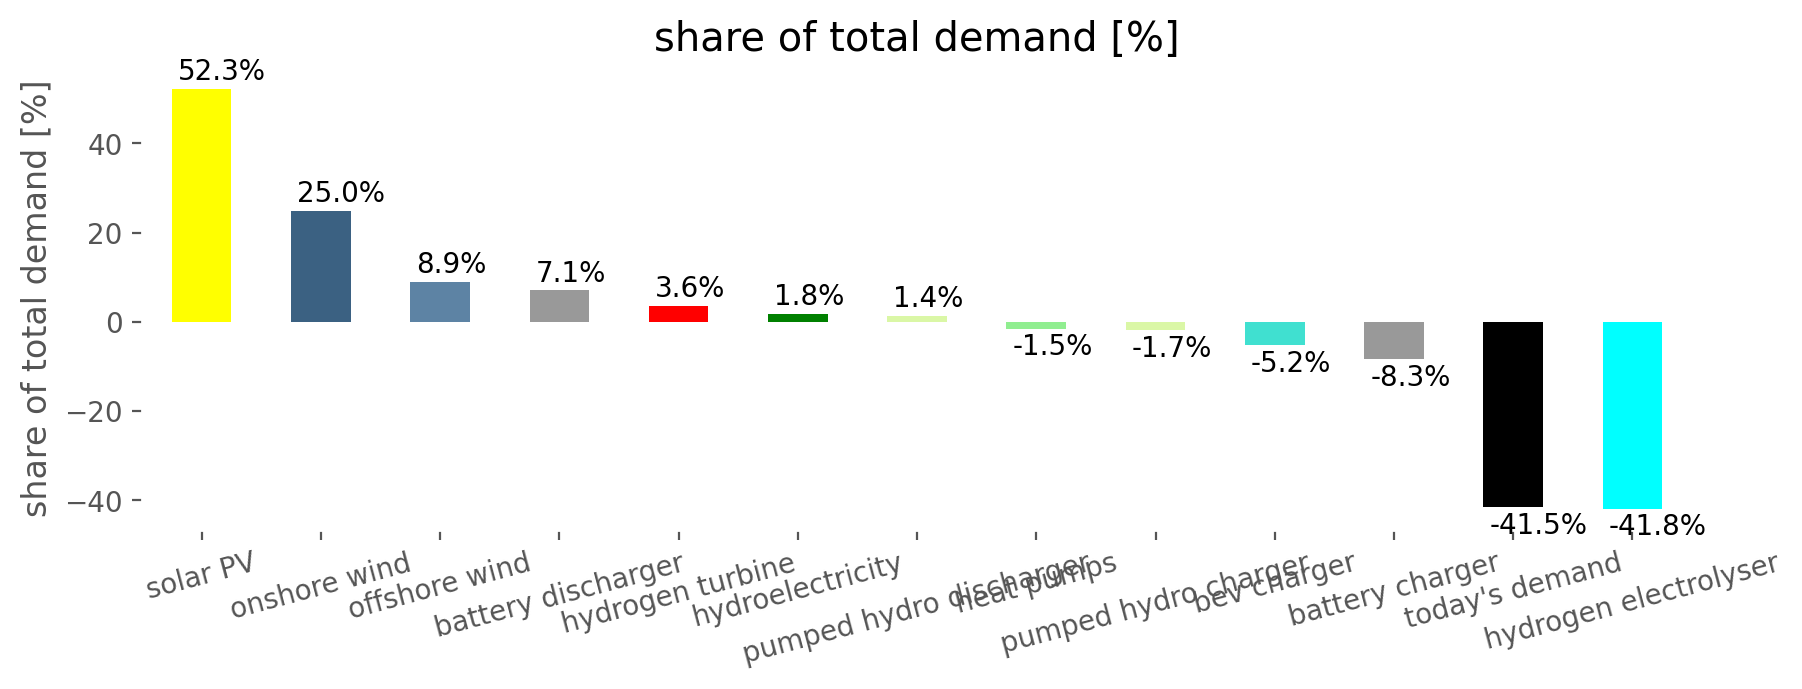
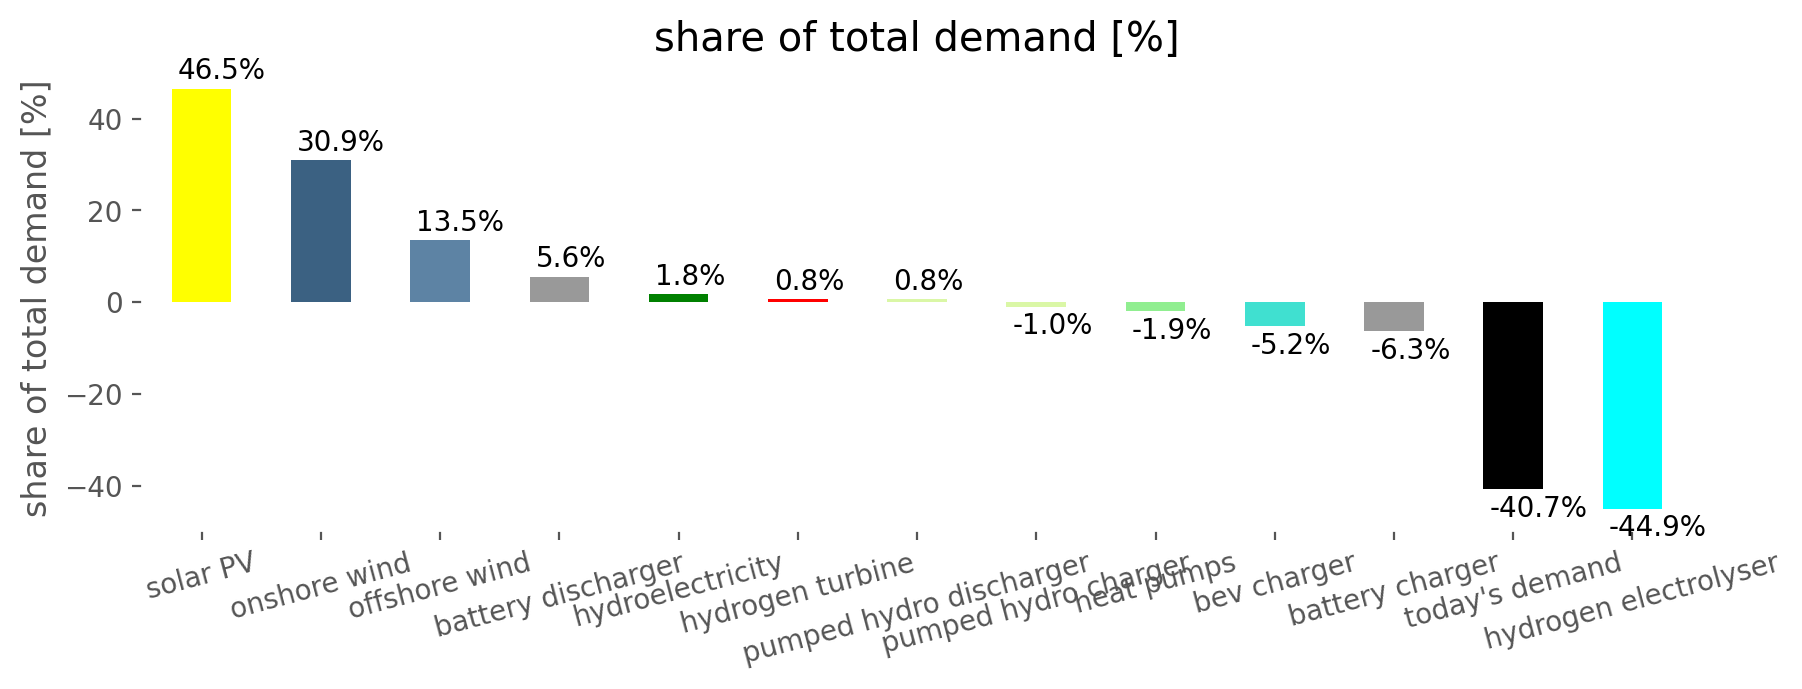
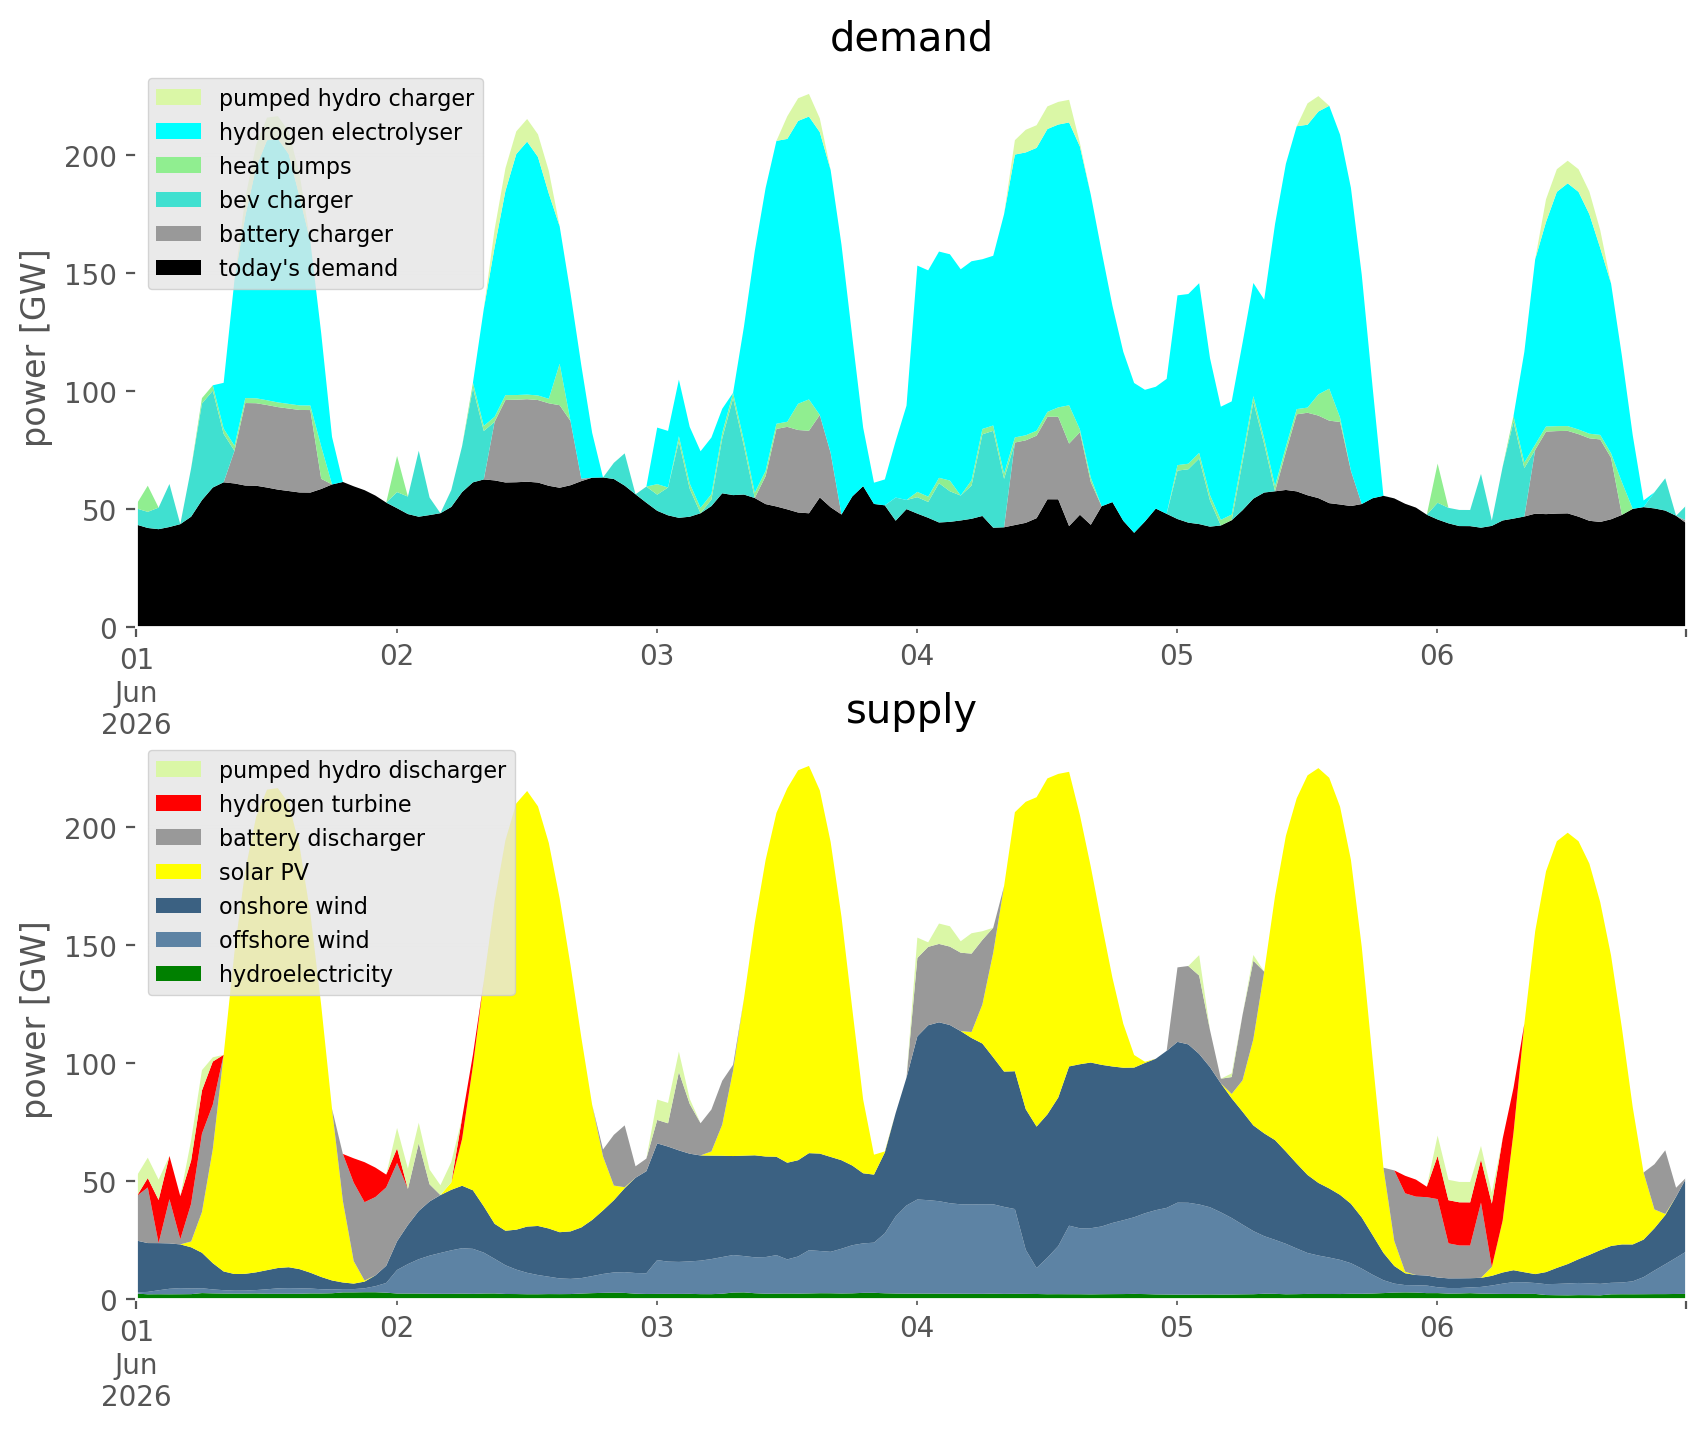
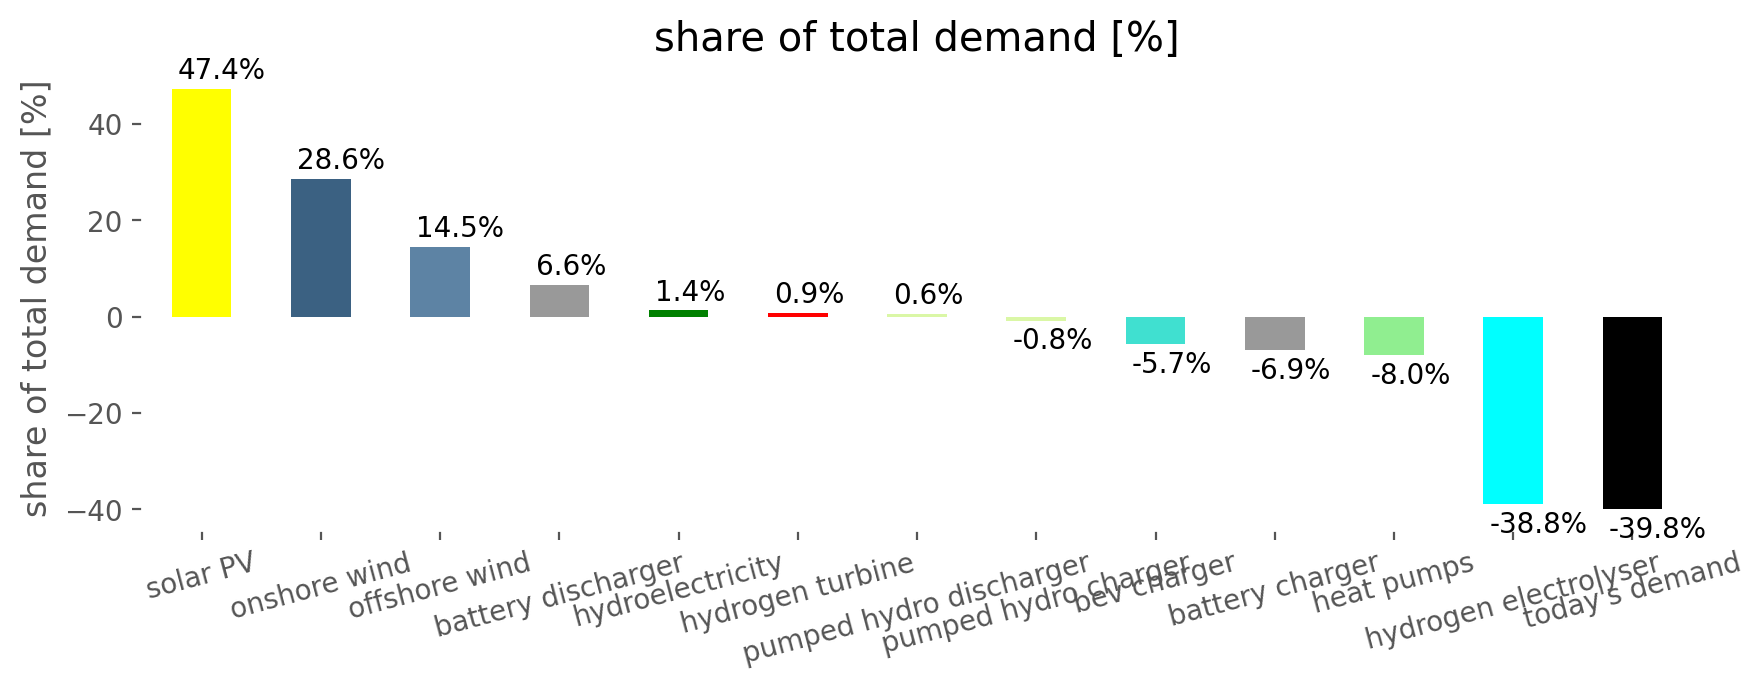
| offshore wind yearly dispatch [TWh/a] | 170.81 |
| onshore wind yearly dispatch [TWh/a] | 333.43 |
| solar PV yearly dispatch [TWh/a] | 416.03 |
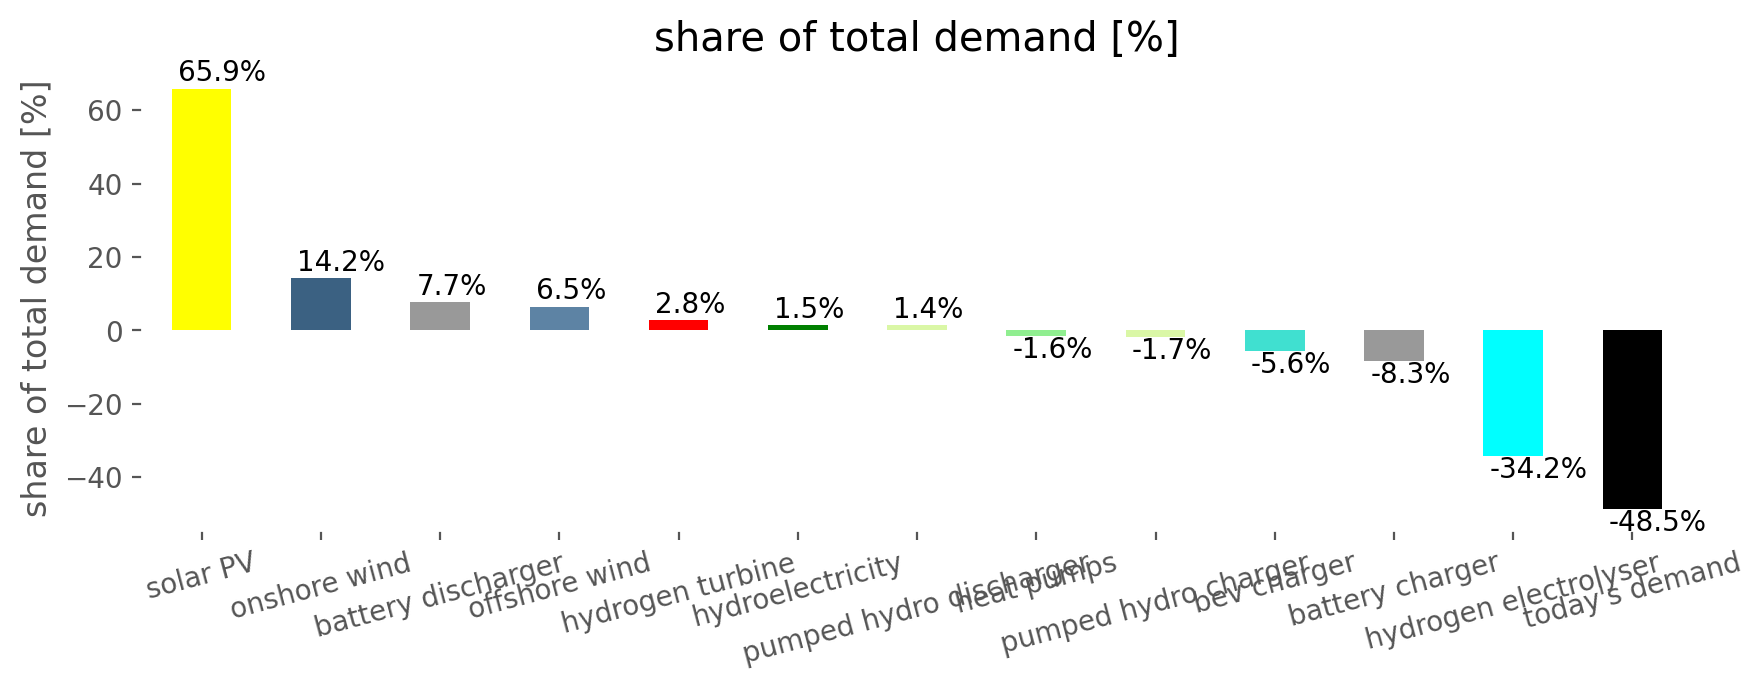
| today's demand yearly dispatch [TWh/a] | 526.53 |
| battery charger yearly dispatch [TWh/a] | 63.22 |
| bev charger yearly dispatch [TWh/a] | 60.00 |
| heat pumps yearly dispatch [TWh/a] | 98.63 |
| hydrogen electrolyser yearly dispatch [TWh/a] | 321.99 |
| pumped hydro charger yearly dispatch [TWh/a] | 11.33 |
| battery discharger yearly dispatch [TWh/a] | 57.06 |
| hydrogen turbine yearly dispatch [TWh/a] | 73.77 |
| pumped hydro discharger yearly dispatch [TWh/a] | 9.17 |
| total demand yearly dispatch [TWh/a] | 1081.70 |
| total demand (excluding storage) yearly dispatch [TWh/a] | 832.12 |
| solar PV yearly available [TWh/a] | 429.22 |
| onshore wind yearly available [TWh/a] | 349.76 |
| offshore wind yearly available [TWh/a] | 191.47 |
| hydroelectricity yearly available [TWh/a] | 21.29 |
| solar PV capacity factor available [%] | 10.20 |
| onshore wind capacity factor available [%] | 19.95 |
| offshore wind capacity factor available [%] | 36.40 |
| hydroelectricity capacity factor available [%] | 48.58 |
| solar PV yearly used [TWh/a] | 416.03 |
| onshore wind yearly used [TWh/a] | 333.43 |
| offshore wind yearly used [TWh/a] | 170.81 |
| hydroelectricity yearly used [TWh/a] | 21.29 |
| solar PV yearly curtailed [TWh/a] | 13.19 |
| onshore wind yearly curtailed [TWh/a] | 16.33 |
| offshore wind yearly curtailed [TWh/a] | 20.66 |
| hydroelectricity yearly curtailed [TWh/a] | 0.00 |
| solar PV average curtailment [%] | 3.07 |
| onshore wind average curtailment [%] | 4.67 |
| offshore wind average curtailment [%] | 10.79 |
| hydroelectricity average curtailment [%] | 0.00 |
| hydroelectricity capacity factor [%] | 48.58 |
| load shedding capacity factor [%] | 0.00 |
| offshore wind capacity factor [%] | 32.48 |
| onshore wind capacity factor [%] | 19.02 |
| solar PV capacity factor [%] | 9.89 |
| battery charger capacity factor [%] | 20.61 |
| battery discharger capacity factor [%] | 19.58 |
| bev charger capacity factor [%] | 2.07 |
| heat pumps capacity factor [%] | 15.00 |
| hydrogen electrolyser capacity factor [%] | 30.61 |
| hydrogen turbine capacity factor [%] | 9.26 |
| pumped hydro charger capacity factor [%] | 13.46 |
| pumped hydro discharger capacity factor [%] | 12.11 |
| hydroelectricity yearly revenue [M€/a] | 1867.66 |
| load shedding yearly revenue [M€/a] | 146.77 |
| offshore wind yearly revenue [M€/a] | 14303.09 |
| onshore wind yearly revenue [M€/a] | 25290.90 |
| solar PV yearly revenue [M€/a] | 17151.00 |
| hydroelectricity average market value [€/MWh] | 87.72 |
| load shedding average market value [€/MWh] | 1000.00 |
| offshore wind average market value [€/MWh] | 83.74 |
| onshore wind average market value [€/MWh] | 75.85 |
| solar PV average market value [€/MWh] | 41.23 |
| DE-battery_charger yearly revenue minus variable costs [M€/a] | 1083.71 |
| DE-battery_discharger yearly revenue minus variable costs [M€/a] | 44.87 |
| DE-bev_charger yearly revenue minus variable costs [M€/a] | 113.67 |
| DE-heat_pumps yearly revenue minus variable costs [M€/a] | 2.79 |
| DE-hydrogen_electrolyser-0 yearly revenue minus variable costs [M€/a] | 1185.07 |
| DE-hydrogen_electrolyser-1 yearly revenue minus variable costs [M€/a] | 1201.19 |
| DE-hydrogen_electrolyser-2 yearly revenue minus variable costs [M€/a] | 1223.87 |
| DE-hydrogen_electrolyser-3 yearly revenue minus variable costs [M€/a] | 1254.56 |
| DE-hydrogen_electrolyser-4 yearly revenue minus variable costs [M€/a] | 1295.36 |
| DE-hydrogen_turbine-0 yearly revenue minus variable costs [M€/a] | 335.05 |
| DE-hydrogen_turbine-1 yearly revenue minus variable costs [M€/a] | 342.53 |
| DE-hydrogen_turbine-2 yearly revenue minus variable costs [M€/a] | 356.26 |
| DE-hydrogen_turbine-3 yearly revenue minus variable costs [M€/a] | 379.18 |
| DE-hydrogen_turbine-4 yearly revenue minus variable costs [M€/a] | 417.39 |
| DE-pumped_hydro_charger yearly revenue minus variable costs [M€/a] | 144.03 |
| DE-pumped_hydro_discharger yearly revenue minus variable costs [M€/a] | 0.36 |
| battery charger average market value [€/MWh] | 37.31 |
| bev charger average market value [€/MWh] | 102.70 |
| heat pumps average market value [€/MWh] | 105.61 |
| hydrogen electrolyser average market value [€/MWh] | 40.73 |
| pumped hydro charger average market value [€/MWh] | 25.71 |
| battery discharger average market value [€/MWh] | 111.37 |
| hydrogen turbine average market value [€/MWh] | 177.53 |
| pumped hydro discharger average market value [€/MWh] | 110.32 |
| total yearly revenue [M€/a] | 68139.31 |
| System levelised cost for demand excluding storage [€/MWh] | 90.85 |
All data & licence
All data available on this website is available openly under the Creative Commons Attribution 4.0 International Licence (CC BY).