Introduction
This tool calculates the cost of producing and transporting green hydrogen and hydrogen-based products such as ammonia, methanol and methane. Green hydrogen is produced by water electrolysis where the electricity comes from wind and solar generators.
First choose the location where the hydrogen-based derivative is produced and the location to which it is delivered. This determines the weather data for the wind and solar generation where the derivative is produced, as well as the transport costs to the destination. Then choose your cost and technology assumptions to find the solution with least cost. Interesting cost levers are: capital costs of electrolysers and hydrogen storage, financing costs and minimum part-load rates of synthesis units.
This is a toy model with a strongly simplified setup. Please read the warnings below.
The tool is a simplified version of the trace model behind the research paper Import options for chemical energy carriers from renewable sources to Germany by Johannes Hampp, Michael Düren and Tom Brown, published in PLOS ONE in 2023.
All code and data behind this tool are openly available.
You may also be interested in our sister websites: model.energy for baseload electricity, an interface to run the detailed European model PyPSA-Eur and a future German renewable power system running on today's weather and demand.
Step 1: Select destination and source locations
Step 2: Choose product, technologies, costs and other assumptions
Choose which technologies should be included:
Show advanced assumption settings
All costs are in 2020 euros. All energy units for fuels are given for the lower heating value (LHV). The exact configuration of technologies for each product can be found at the back of the paper Hampp et al, 2023.
Step 3: Solve and wait for results
Ready in around 120 seconds, status: Waiting for job
Results
Costs are in 2020 euros. Energy units for fuels are given for the lower heating value (LHV). Total costs comprise production and transport of the products, but not taxes or other charges. Compare costs to historical market prices of fossil-based products in Europe.
electricity supply and demand time series (you can zoom and pan to see the details)
hydrogen supply and demand time series (you can zoom and pan to see the details)
| Asset | Capacity | Cap Ftr used [%] | Cap Ftr avail [%] | Curtlmt [%] | LCOE [EUR/MWh] |
|---|
Background and warnings
This is a toy model with a strongly simplified setup. Please read the warnings before interpreting the results.
The tool is a simplified version of the model behind the research paper Import options for chemical energy carriers from renewable sources to Germany by Johannes Hampp, Michael Düren and Tom Brown, published in PLOS ONE in 2023. See the differences to the paper.
Warnings
- Technologies such as direct air capture and shipping for liquid hydrogen are not yet widely commercially deployed, so results that rely on these technologies should be treated with caution.
- Future cost projections are uncertain. If the technologies scale up faster than anticipated, costs will come down faster as manufacturers leverage experience and learning-by-doing.
- The transport route is not calculated precisely. Instead, a factor is multiplied by the direct distance to account for indirect transport routes. For pipelines and cables the default factor is 1.2 and for shipping the default is 1.8 (since sea routes may have to go around continents). You can change this assumption.
- At the moment all pipeline and cable costs use the submarine cost. In the future we will offer an overland cost where the user can change the fraction of the route that is over land or under sea. The submarine costs are higher than overland, so this is a conservative assumption.
- Costs for shipping terminals at the exporting and importing locations are not included.
- The shipping model is simplified. We assume that there are enough ships for a continuous delivery of products. The number of ships needed takes into account the time it takes the ships to do a return trip including loading and unloading the products. The continuous delivery means that the model neglects the need for buffer storage at the shipping terminals.
- The default costs for hydrogen storage assumes that hydrogen is stored in overground steel tanks. If underground hydrogen storage is available, for example in salt caverns, change the overnight cost to 2 EUR/kWh and the lifetime to 50 years. Studies on salt deposit availability are available for most countries, see e.g. this map for Europe or Figure 2 of NREL 2009 for the United States.
- The default setting restricts power generation to wind solar. Additional low-carbon generation technologies which may reduce costs include using existing hydroelectric generators, biomass from sustainable resources (such as waste and agricultural/forestry residues), offshore wind, concentrating solar thermal, geothermal, ocean energy, nuclear and fossil/biomass plants with CCS. Two additional dispatchable technologies are provided under "advanced assumption settings". Additional storage technologies include redox flow batteries, compressed air energy storage, etc.
- No import or export capacities with other regions are assumed, so each region must supply demand as an island. Existing and planned transmission grid connections between regions can reduce electricity costs by up to 20% by smoothing wind over a continent-sized area (see e.g. this paper or this one).
- The time series for wind and solar generation are based on weather data from the European Centre for Medium-Range Weather Forecasts (ECMWF) ERA5 reanalysis dataset. Reanalysis datasets are generated by fitting numerical weather simulations to real measured data. In regions where real measurements are sparse, reanalysis data may deviate from observed weather patterns. In addition, reanalysis datasets may not always capture clouds accurately, so for PV generation it is advisable to include satellite observations in calculations, such as the CMSAF SARAH II dataset (available only for Europe and Africa). Weather data is converted to power generation using the atlite library. No further corrections are applied, except a 7% linear scaling down of solar generation time series to fit measured European capacity factors for 2011-2013.
- The wind profiles used here are converted from wind speed time series assuming an existing wind turbine model (Vestas V112 3MW with a hub height of 80m). Newer and future turbines will have higher capacity factors because e.g. they're taller, capturing wind energy where resources are better.
- Solar profiles are calculated assuming that panels in the northern hemisphere face south, and that panels in the southern hemisphere face north, with a slope of 35 degrees against the horizontal in both cases.
- Costs for ancillary services inside each production island are not included.
- To avoid long job times, the default here is to run only for a single weather year sampled at most every 3 hours. You can download the code yourself and run hourly for multiple weather years.
- The joint production of electricity and hydrogen can lead to lower costs for both, particularly for a low ratio of hydrogen to electricity production. Flexible electrolyser demand creates flexibility for integrating wind and solar for electricity production. However, operating the hydrogen production in island mode can save costs compared to joint production, since the alternating current doesn't have to match a perfect sine wave. This saves on power electronic costs.
- We do not allow waste heat integration. For example, the waste heat from methanol or Fischer-Tropsch synthesis could be fed to supply the heat demand of direct air capture.
- Lower reliability delivery of products than baseload may cost less, especially for electricity and hydrogen, which are hard to store.
- The minimum must-run level also represents availability, taking into account maintenance sheduling for many aggregated units.
Differences to model in Hampp et al, 2023
This tool is a simplified version of the model behind the research paper Import options for chemical energy carriers from renewable sources to Germany by Johannes Hampp, Michael Düren and Tom Brown, published in PLOS ONE in 2023 (Hampp et al, 2023).
The following list highlights the main differences.
- The default cost assumptions for hydrogen storage in steel tanks in the paper are higher than on this website. The paper assumes costs of steel tanks in 2030 of around 45 EUR/kWh, FOM 2% and lifetime of 30 years; use these values to reproduce the paper's results. The website uses for Type I steel tanks costs in 2030 of 12.23 EUR/kWh, FOM 2% and lifetime of 20 years.
- The paper assumes that the best wind and solar resources in each country are used for domestic energy and excludes these areas from being used for hydrogen-based product exports. Since this website only allows point locations for wind and solar, we do not do this. This effect can lead to slightly lower costs on the website compared to the paper for densely-populated countries like Germany.
- The model for the paper allows many wind and solar locations in each country to be combined. This leads to a smoothing effect across the country that reduces balancing costs compared to a plant at a single location. This effect makes the costs on the website higher than the paper in most countries with good wind and solar resources in sparsely-populated areas.
- The paper assumes that product demand is fixed for the year, but is not strict about when the product is delivered during the year. The website requires baseload delivery of the product. This makes the website results more expensive.
- The paper used GlobalEnergyGIS for processing the weather data, whereas the website uses the atlite library.
- The paper uses a default minimum part load of 94.25% for methanol and Fischer-Tropsch synthesis, and 30% for NH3 and CH4. The website has a default of 50% for methanol synthesis, 90% for Fischer-Tropsch and 30% for NH3 and CH4.
- The paper includes compression costs and energy demand for liquid CO2 tanks, whereas the website ignores these since the effect is tiny.
- The paper displays results in 2015 euros, whereas the website uses 2020 euros.
- The website has a simplified version of the shipping model in the paper (see warnings above).
- The website includes the option for electricity delivered by HVDC cable, with hydrogen storage used as long-duration storage on the producer side. This option was not available in the paper, but the paper had instead electricity transmission followed by electrolysis on the consumer side.
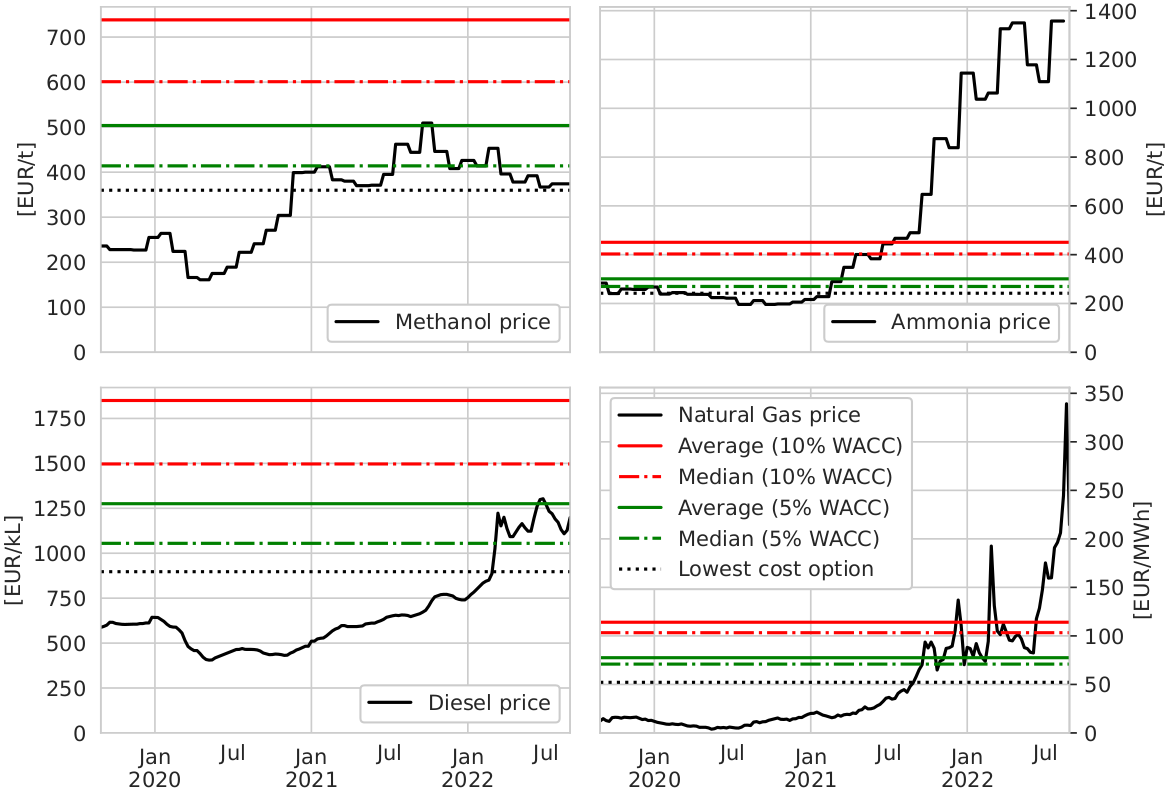
Historical market prices of fossil-based products in Europe
The following graphic from Hampp et al, 2023 shows historical wholesale market prices in EUR-2015 of fossil-based products in Europe (black lines) versus the costs of hydrogen-based products the authors calculated for 2050 technology assumptions. Market prices for methanol are based on MMSA Europe Spot FOB, for ammonia on German export prices for ammonia, for natural gas on the Dutch TTF C1 future and for Fischer-Tropsch products on EU Diesel prices without taxes.
Only free software and open data
The graphical user interface, weather processing, optimisation model construction, solver and post-processing are all built with free software and open data only. The code for all parts except the solver can be downloaded from the GitHub repository efuels-server. It uses the Python for Power System Analysis (PyPSA) energy optimisation framework, open weather data from the European Centre for Medium-Range Weather Forecasts (ECMWF) ERA5 reanalysis dataset, the atlite library for converting weather data to generation profiles, D3.js for graphics, Mapbox, Leaflet and Natural Earth for maps, Clp for the solver, and free software for the server infrastructure (GNU/Linux, nginx, Flask, gunicorn, Redis).
The code is a simplified version of the trace model by Johannes Hampp used in Hampp et al, 2023.
New functionality coming soon
See the GitHub issue tracker.
Problems/comments/feedback/help out
If you encounter any problems please report them using the GitHub issue tracker. It would be helpful to note the jobid and any other error messages from your browser's JavaScript console (find the console via your browser's "Developer Tools").
If you want to help out and contribute improvements, please submit a pull request!
Any other feedback and comments can be sent to Tom Brown.
Contributors and thanks
- Tom Brown conceived and developed the website.
- Johannes Hampp developed the original trace model on which this website is based.
- Bo Tranberg of Ento Labs implemented the user interface in bootstrap.
- Jonas Hörsch developed the library atlite that processes the weather data and selects different geographical areas.
We thank also all the developers of the other free software on which model.energy depends.
Comparable websites
Here we list other websites that compute the costs of delivering hydrogen-based fuels. As far as we know, this website is the only one that does live optimisation with hourly time series.
- Global PtX Atlas by Fraunhofer IEE
- Hydrogen-model.eu
- Wasserstoff Atlas
Privacy statement
No personal information is stored on the server. There are no cookies.
Simulation assumptions and results for each job are stored on the server for statistical purposes.