Compare previously calculated scenarios
home | submit | results
Summary results
date and time submitted
name
id & link
system costs [bnEUR/a]
marginal abatement cost [EUR/tCO2]
difference to default
downloads
2024-10-12 19:26:33
10%_international_2030ies
bcd8281b-0aff-4030-acce-7f8d5e2aedd1
527.62
197.33
solar_cost: 302.0 -> 500.0; offwind_cost: 1416.0 -> 1800.0; onwind_cost: 963.0 -> 1200.0; nuclear_cost: 7940.0 -> 10000.0; electrolysis_cost: 500.0 -> 800.0; co2_limit: 0.0 -> 0.1
zip file of all results | PyPSA network file | config.yaml file
Table of contents
Breakdown of yearly system costs
All costs are in 2015 euros, EUR-2015.
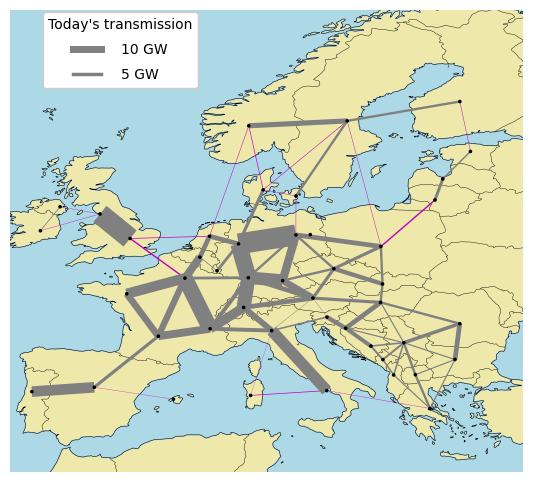
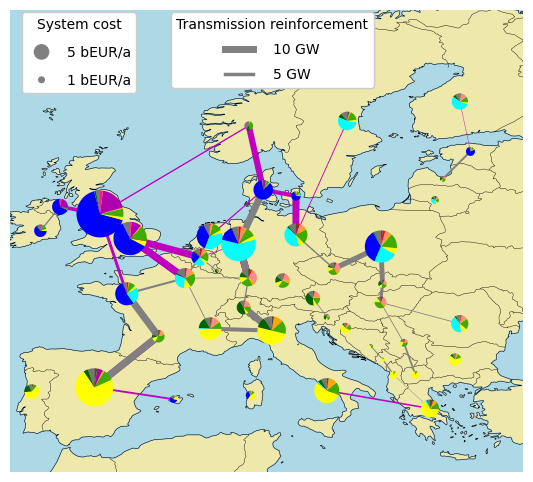
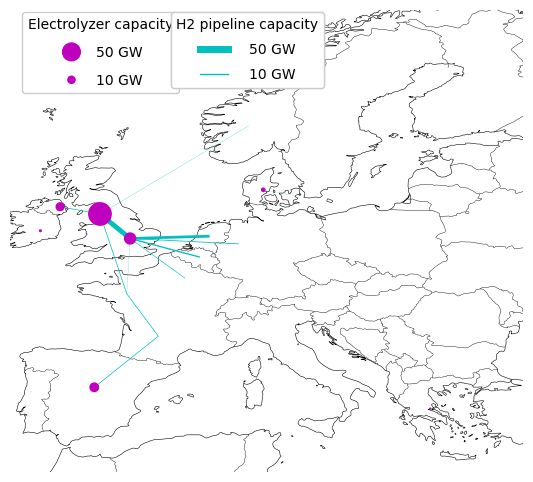
0 50 100 150 200 250 300 350 400 450 500 550 system costs [bnEUR/a] 10%_international_2030ies
SMR CC CO2 sequestration H2 pipeline H2 Electrolysis hydrogen storage fossil gas gas boiler gas CHP biomass CHP resistive heater air heat pump ground heat pump solar PV rooftop solar PV utility offshore wind (DC) offshore wind (AC) onshore wind fossil oil biogas solid biomass hydroelectricity electricity distribution grid transmission lines
Maps
starting grid | grid reinforcement and other investments | hydrogen network and electrolyser capacity
bcd8281b-0aff-4030-acce-7f8d5e2aedd1 | 10%_international_2030ies
Technology capacities
0 500 1,000 1,500 2,000 2,500 3,000 3,500 capacities [GW] 10%_international_2030ies
ground heat pump air heat pump resistive heater H2 Electrolysis Fischer-Tropsch hydroelectricity onshore wind offshore wind (AC) offshore wind (DC) solar PV utility solar PV rooftop nuclear OCGT H2 Fuel Cell biomass CHP gas CHP
Energy balances by carrier
high voltage electricity supply and demand
-5,000 -4,000 -3,000 -2,000 -1,000 0 1,000 2,000 3,000 4,000 5,000 energy [TWh/a] 10%_international_2030ies
gas CHP biomass CHP solar PV utility offshore wind (DC) offshore wind (AC) onshore wind hydroelectricity electricity distribution grid H2 Electrolysis
low voltage electricity supply and demand
-5,000 -4,000 -3,000 -2,000 -1,000 0 1,000 2,000 3,000 4,000 5,000 energy [TWh/a] 10%_international_2030ies
solar PV rooftop electricity distribution grid ground heat pump air heat pump resistive heater BEV charger industry electricity non-industrial electricity
hydrogen supply and demand
-1,000 -800 -600 -400 -200 0 200 400 600 800 1,000 energy [TWh/a] 10%_international_2030ies
SMR H2 Electrolysis H2 for industry H2 for shipping land transport fuel cell
methane supply and demand
-2,000 -1,500 -1,000 -500 0 500 1,000 1,500 2,000 energy [TWh/a] 10%_international_2030ies
fossil gas biogas gas CHP OCGT gas boiler SMR gas for industry
liquid hydrocarbon supply and demand
-1,200 -1,000 -800 -600 -400 -200 0 200 400 600 800 1,000 1,200 energy [TWh/a] 10%_international_2030ies
fossil oil kerosene for aviation naphtha for industry
CO2 supply and demand
-700 -600 -500 -400 -300 -200 -100 0 100 200 300 400 500 600 700 CO2 [MtCO2/a] 10%_international_2030ies
industry oil emissions gas for industry aviation oil emissions SMR gas boiler gas CHP biogas biomass CHP CC co2
stored CO2 supply and demand
-200 -150 -100 -50 0 50 100 150 200 CO2 [MtCO2/a] 10%_international_2030ies
CC biomass CHP CO2 sequestration
residential rural building heating supply and demand
-1,200 -1,000 -800 -600 -400 -200 0 200 400 600 800 1,000 1,200 energy [TWh/a] 10%_international_2030ies
gas boiler resistive heater ground heat pump heat
urban district heating supply and demand
-1,400 -1,200 -1,000 -800 -600 -400 -200 0 200 400 600 800 1,000 1,200 1,400 energy [TWh/a] 10%_international_2030ies
gas boiler gas CHP biomass CHP resistive heater air heat pump heat low-temperature heat for industry
Primary energy
Note that primary energy for wind, solar and hydroelectricity
is accounted for using the direct equivalence method,
i.e. assuming a 100% correspondence between primary energy and
electricity generation.
0 1,000 2,000 3,000 4,000 5,000 6,000 7,000 8,000 9,000 10,000 11,000 primary energy [TWh/a] 10%_international_2030ies
fossil gas ambient air heat ambient ground heat solar PV rooftop solar PV utility offshore wind (DC) offshore wind (AC) onshore wind fossil oil biogas solid biomass hydroelectricity
Final energy and non-energy
Electricity includes electricity demand from electric
vehicles, newly-electrified industry and heat pumps in individual
buildings, but excludes electricity demand for water
electrolysis. Hydrogen includes hydrogen demand for land
transport, shipping, industry and ammonia production, but
excludes hydrogen demand for synthesis into hydrocarbons. Liquid
hydrocarbons include aviation fuel and feedstock for basic
chemicals production (mostly for plastics).
0 1,000 2,000 3,000 4,000 5,000 6,000 7,000 8,000 9,000 final energy [TWh/a] 10%_international_2030ies
district heat liquid hydrocarbons hydrogen methane electricity
Time series for system operation
Select scenario to show operational dispatch over a year to meet the demand (can take several seconds to load; series are aggregated over all nodes; energy supply and storage withdrawal is positive, demand and storage charging is negative)
bcd8281b-0aff-4030-acce-7f8d5e2aedd1 - 10%_international_2030ies
high voltage electricity supply and demand time series
low voltage electricity supply and demand time series
hydrogen supply and demand time series
methane supply and demand time series
liquid hydrocarbon supply and demand time series
CO2 supply and demand time series
stored CO2 supply and demand time series
residential rural building heating supply and demand time series
urban district heating supply and demand time series